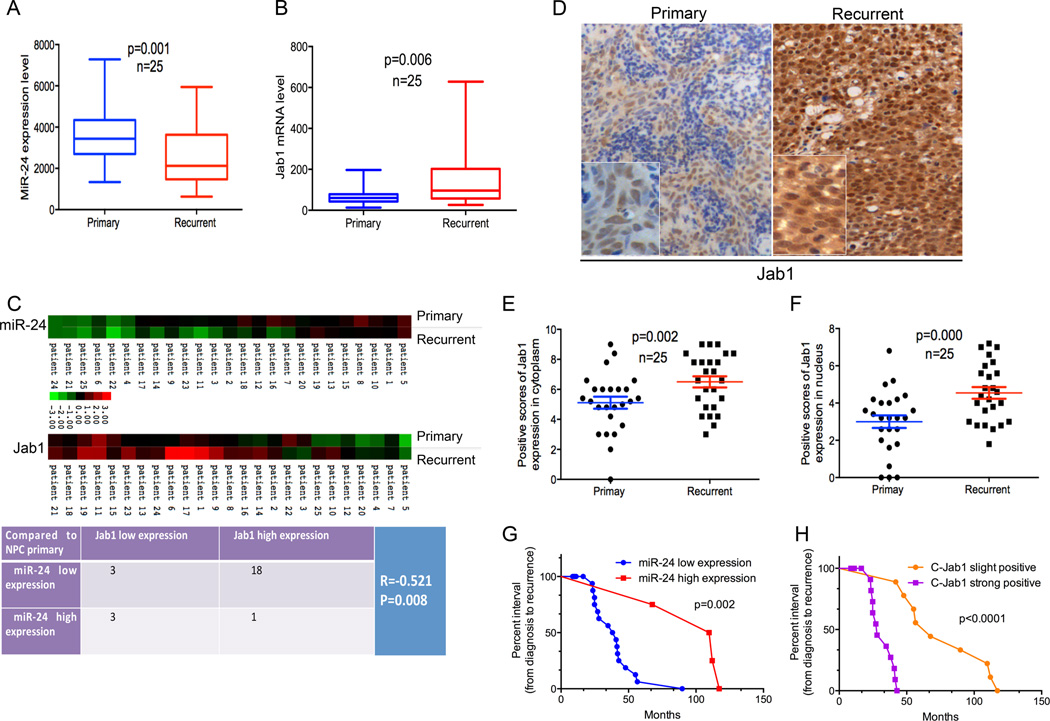
Figure 6.
Inverse correlation between miR-24 and Jab1 in NPC patient samples and closely associated with a shorter interval from initial treatment to NPC recurrence. (A) qNPA analysis of miR-24 levels in both primary and matched recurrent NPC samples from 25 patients was shown. Experiments were performed in triplicate. The paired Student’s t-test was used for statistical analysis. (B) qNPA analysis of Jab1mRNA levels in primary and matched recurrent NPC samples from 25 patients. Experiments were performed in triplicate. The paired Student’s t-test was used for statistical analysis. (C) Heat-map showing the expression of miR-24 and Jab1 in 25 patient samples, comparing primary and recurrent NPC tissues (upper panel). The lowest expression is represented by green and the highest expression by red. Data were normalized to the median value by log2 before mapping using software programs Cluster and TreeView. The Spearman correlation test was used to validate the correlation between miR-24 and Jab1 expression in NPC primary and recurrent samples (bottom panel). (D) Representative immunohistochemistry photos of Jab1 protein level in primary and recurrent NPC tissues from patient samples. (E and F) The positive scores of Jab1 expression in cytoplasm and nucleus are shown. The paired Student’s t-test was used for statistical analysis. (G) Kaplan-Meier analysis of miR-24 expression, with the interval from initial treatment to NPC recurrence. MiR-24 high level is consistent with long interval. The log-rank test was used to perform statistical analysis. (H) Kaplan-Meier analysis of Jab1 expression, with the interval from initial treatment to NPC recurrence. Jab1 low protein level in cytoplasm is consistent with long interval. P-value is from log-rank analysis.

