
Figure 4.
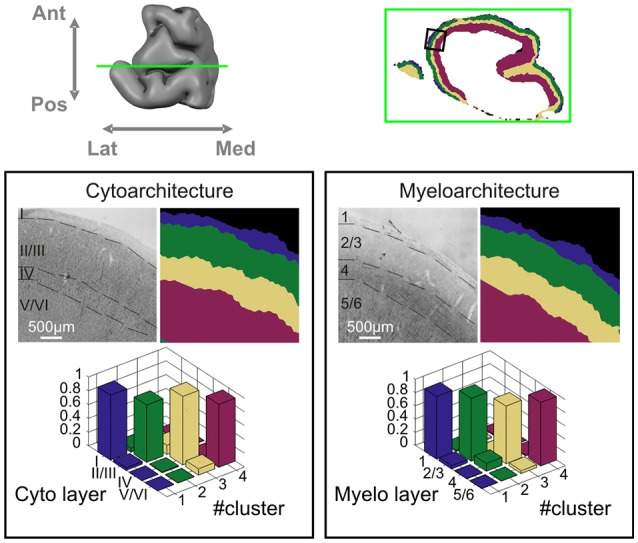
Histological validation. Correspondence between the four-layer cluster result of dataset 1 and histology on the same tissue block. Upper row: location of the coronal section. Lower panels: correspondence to cytoarchitecture (left) and myeloarchitecture (right). For each panel, the upper row depicts histological classification of layers and dMRI layer cluster result, and bottom row shows the cross-table contingency analysis between histology and dMRI based layer clustering.