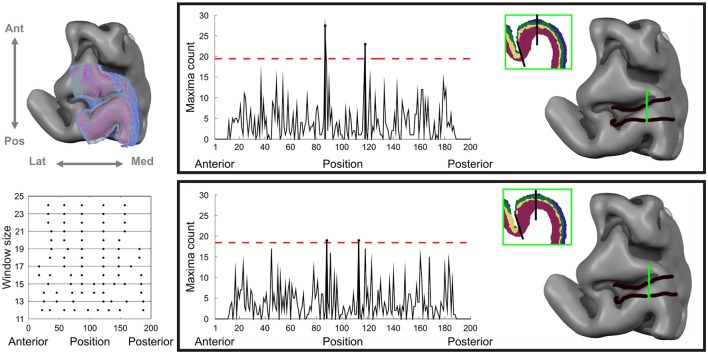
Figure 5.
Automated observer independent cortical area boundary detection on dMRI data. Left column, upper inset: cortical depth sampling grid straddling the precentral gyrus and sulcus. Left column, lower inset: thresholded Hotelling's statistics for significant detected boundary over different window sizes and cortical anterio-posterior position. Right panels for dataset 1 (top) and dataset 2 (bottom): on the left the significant boundary index summed over scales with the horizontal line corresponding to 4.5 standard deviations and on the right the identified super threshold cortical area boundaries on the sampling grid.

