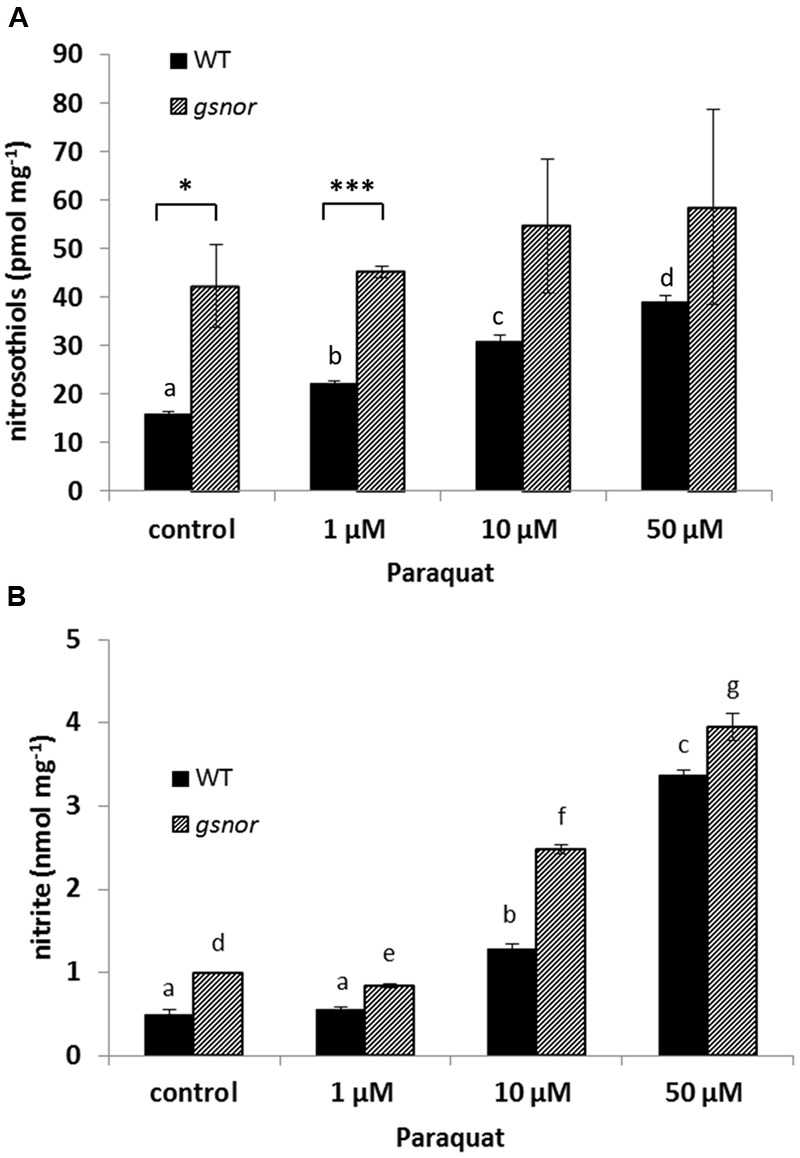
FIGURE 2.

Paraquat-induced changes in NO metabolism. Crude leaf extracts from 4-week-old WT (black bar) and gsnor (gray bar) plants exposed to different paraquat concentrations (1, 10, and 50 μM) for 24 h were used for determination of nitrosothiol (A) and nitrite (B) contents. Values were normalized against total protein content and represent the mean ± SD calculated from three replicates. The different letters indicate significant differences among the samples (p < 0.05, Anova) and ∗p < 0.05, ∗∗∗p < 0.001 represent significant differences between WT and gsnor (a).
