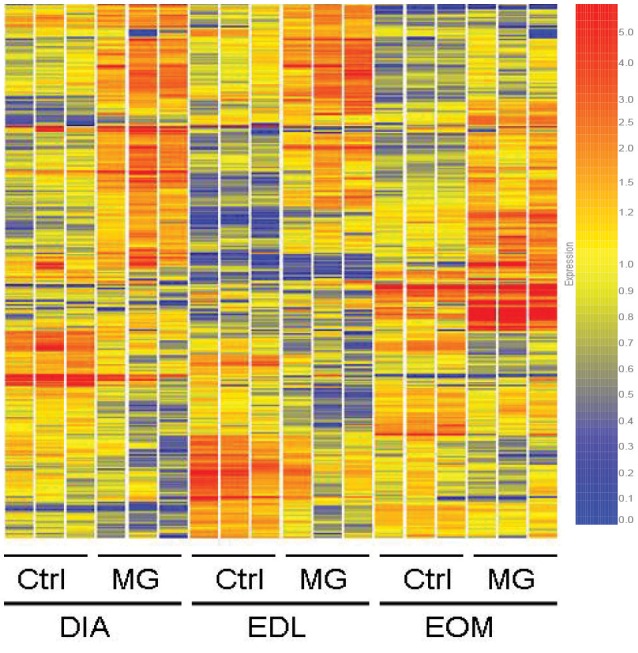
Figure 2.

Hierarchical cluster analysis using 359 gene probes identified as differentially expressed in EAMG among DIA, EDL, and EOM. The three independent replicates of each group are represented. Expression ratios are color-coded. The scale at the right denotes normalized expression levels (red, high expression; blue, low expression).
