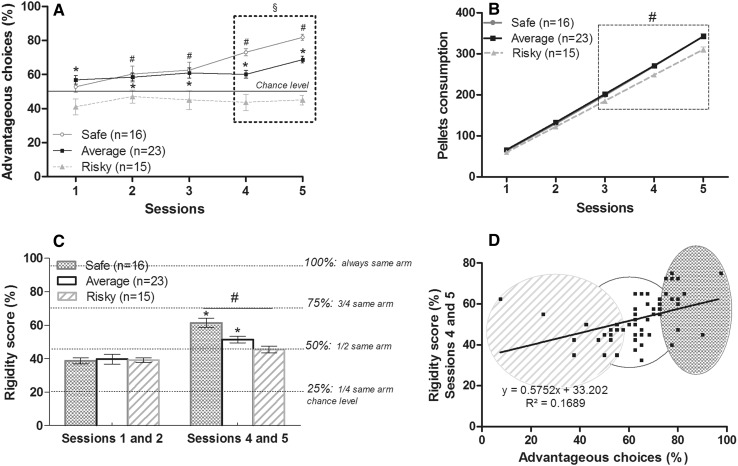
Fig. 2.
Inter-individual differences that emerged during the MGT. a Performances evolution during MGT for safe (n = 16, grey circle), average (n = 23, black square) and risky animals (n = 15, grey triangle). Safe and average groups differed from chance but not risky group (W safe, # p < 0.05; average, *p < 0.05). The three sub-groups differed from each other during the two last sessions (MW, § p < 0.05). b Cumulative pellet consumption across sessions (addition of pellets obtained from the beginning for each session). Safe and average animals did not differ from each other but the three groups differed the three last sessions (KW, # p < 0.05). c Rigidity score was calculated as the percentage of the more chosen arms during the two first sessions and the two last sessions of the task. A 25 % score reflected an equal choice between the 4 arms and a 100 % score reflected a systematic choice of the same arm. Rigidity score of safe and average animals differed between sessions 1 and 2 and sessions 4 and 5 (W, *p < 0.05) and the three groups differed from each other during sessions 4 and 5 (KW, # p < 0.05) with safe mice exhibiting more rigid behavior. Animals’ performance during the 30 last trials were correlated with the rigidity score (d, p < 0.05). Safe animals are grouped in the darker ellipse, average animals are enclosed in the white circle, and risky animals grouped in the grey stripes

