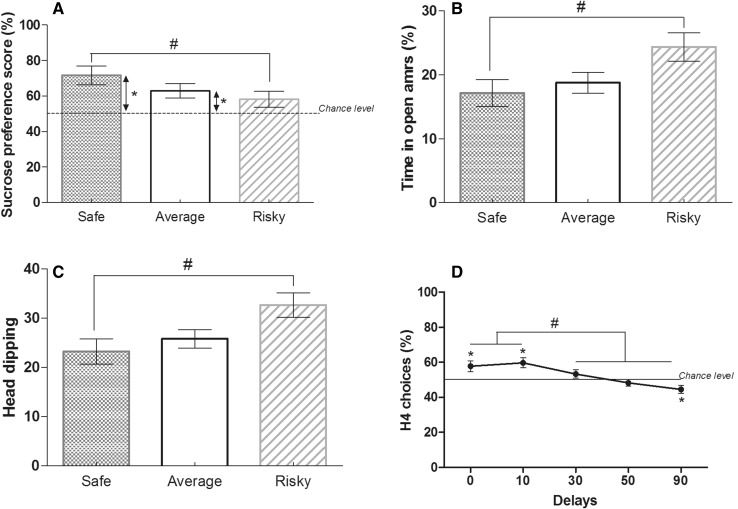
Fig. 3.
Individual behavioral characterization. a During the sucrose preference task, average (n = 23) and safe (n = 16) animals significantly preferred sucrose over water whereas risky mice (n = 14) did not differ from chance (W, *p < 0.05). Safe and risky animals differed from each other (MW, # p < 0.05). b Risky (n = 15) animals spent more time in the open arms of the elevated plus maze and did more head dipping (c; MW, # p < 0.05) than average (n = 23) and safe (n = 16) mice. d Percentage of H4 choices during the delay reward task changed across sessions (W, differences from chance *p < 0.05; differences between sessions # p < 0.05) but there was no differences between groups and no interaction groups × sessions

