Fig. 4.
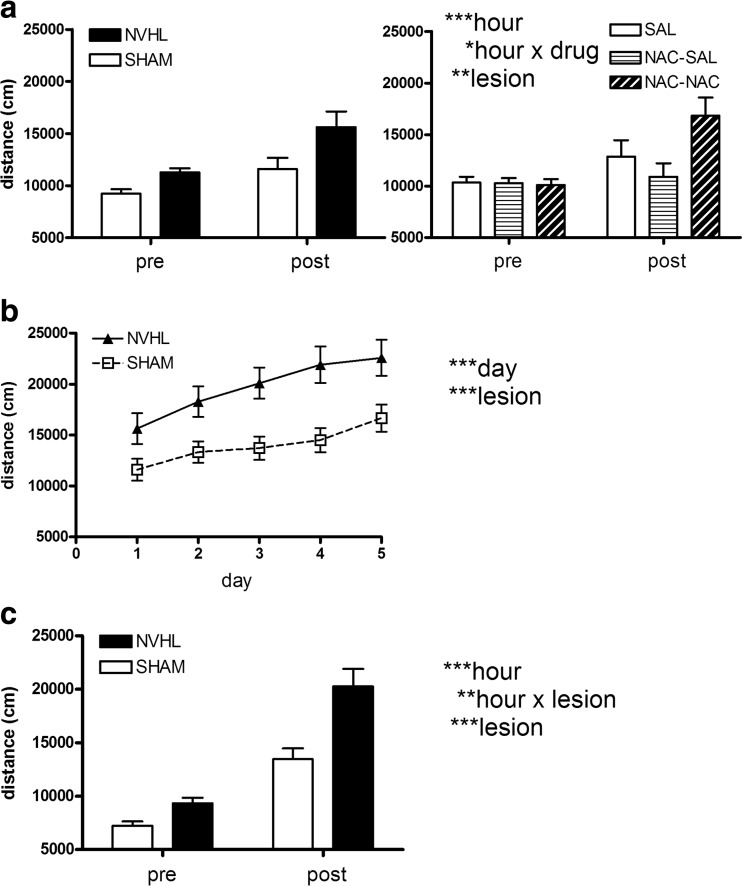
Cocaine sensitization (experiment 1). Data are shown primarily according to lesion grouping only, given that significant lesion-based differences were identified across all three stages of behavioral sensitization. Pre and post-injection locomotor distance (per hour) surrounding the first cocaine injection (a) is shown according to lesion grouping in the left panel, with the same data grouped according to drug treatment in the right panel. Short-term sensitization over the first 5 days of cocaine injections (growth of post-injection distance) (b) and pre and post-injection locomotor distance in the cocaine challenge session (c) (to detect long-term sensitization) reveal robustly significant lesion effects. Total rats and subgroup numbers examined are same shown in Fig. 1. Data are depicted as means ± SEMs. All significant main effects and interactions of the mixed ANOVA are shown at right with significance levels denoted as *p < 0.05, ** p < 0.01, and *** p < 0.001

