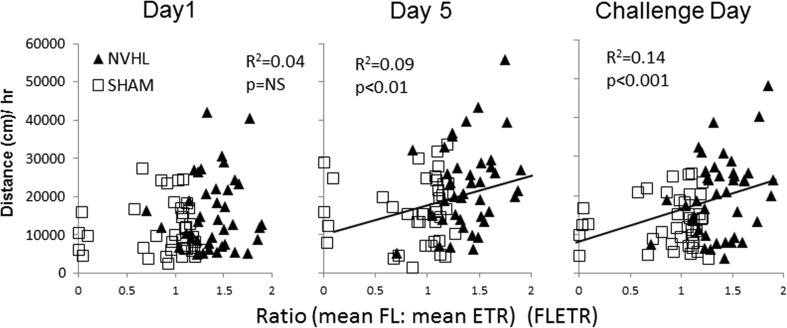
Fig. 5.
RAM performance as linear estimator of subsequent cocaine sensitization (experiment 1). Scatter plots show post-cocaine locomotor activation (y-axis) plotted for each rat as a function of its RAM performance calculated as the ratio of mean Froot loops consumed to mean ETR recorded across the six bins (FLETR; x-axis). Over the entire population (N = 80), R 2 values and significance levels of the linear regression (slope) characterizing a relationship between FLETR and subsequent cocaine-induced locomotion strengthens with more cocaine injections, rightward across panels, as the measured locomotor activation levels represent increasing contributions encoded by the behavioral sensitizing effects of cocaine. The best fit linear equations for day 5 and challenge day sessions were y = 7,539x + 10,979, and y = 8,334x + 7,310, where y = cocaine-induced locomotion (in centimeter) and x = FLETR

