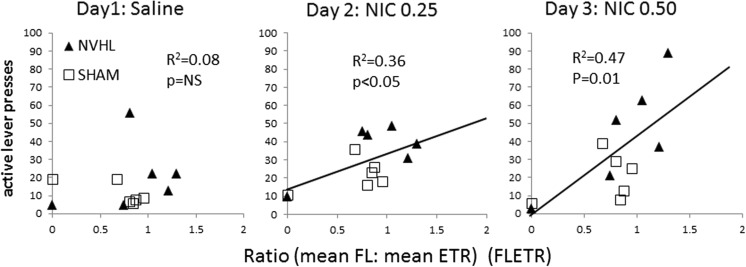
Fig. 8.
RAM performance as a linear estimator of subsequent nicotine-seeking (experiment 2). Scatter plots show nicotine-paired (active) lever pressing during reinstatement sessions (y-axis) plotted for each rat as a function of its RAM performance calculated as the ratio of mean Froot loops consumed to mean ETR recorded across the five bins (FLETR; x-axis). Over the population of rats in the study (n = 12), R 2 values and significance levels of the linear regression (slope) characterizing a relationship between FLETR and subsequent nicotine-seeking strengthens rightward across panels, as the relapse-provoking dose of nicotine increases. The best fit linear equations for 0.25 and 0.50-mg nicotine doses were y = 20.4x + 13.4, and y = 43.8x − 1.7, where y = lever pressing and x = FLETR

