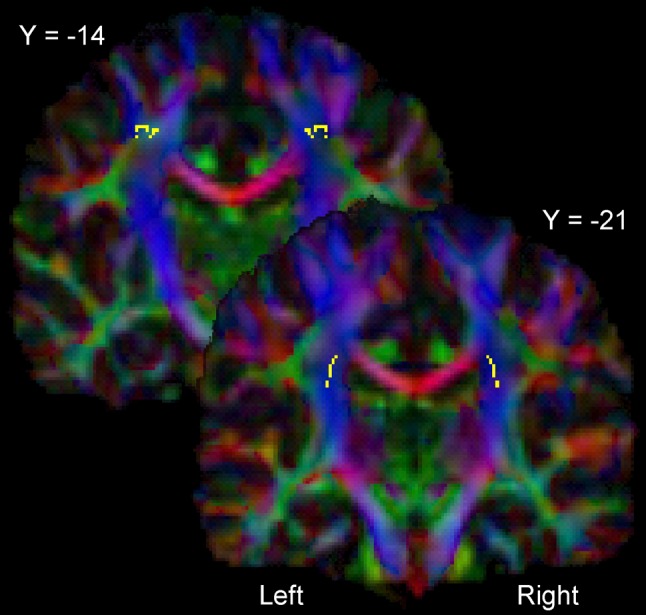
Fig. 6.

Statistical parametric maps showing those voxels where the right–left difference in FA shows a significant linear relationship with the right–left asymmetry in circle drawing as indexed by LICV (p < 0.05, correction for multiple comparisons). The voxels are presented as axial slice overlaid on the color-coded group FA map. The color-coding depicts the direction of the primary eigenvectors of the diffusion tensor in each voxel as follows: anterior-posterior in green, superior-inferior in blue and left–right in red. The two slices shown are MNI slice y = −21 (corona radiata) and MNI slice y = −14, depicting a complex region containing crossing fibers
