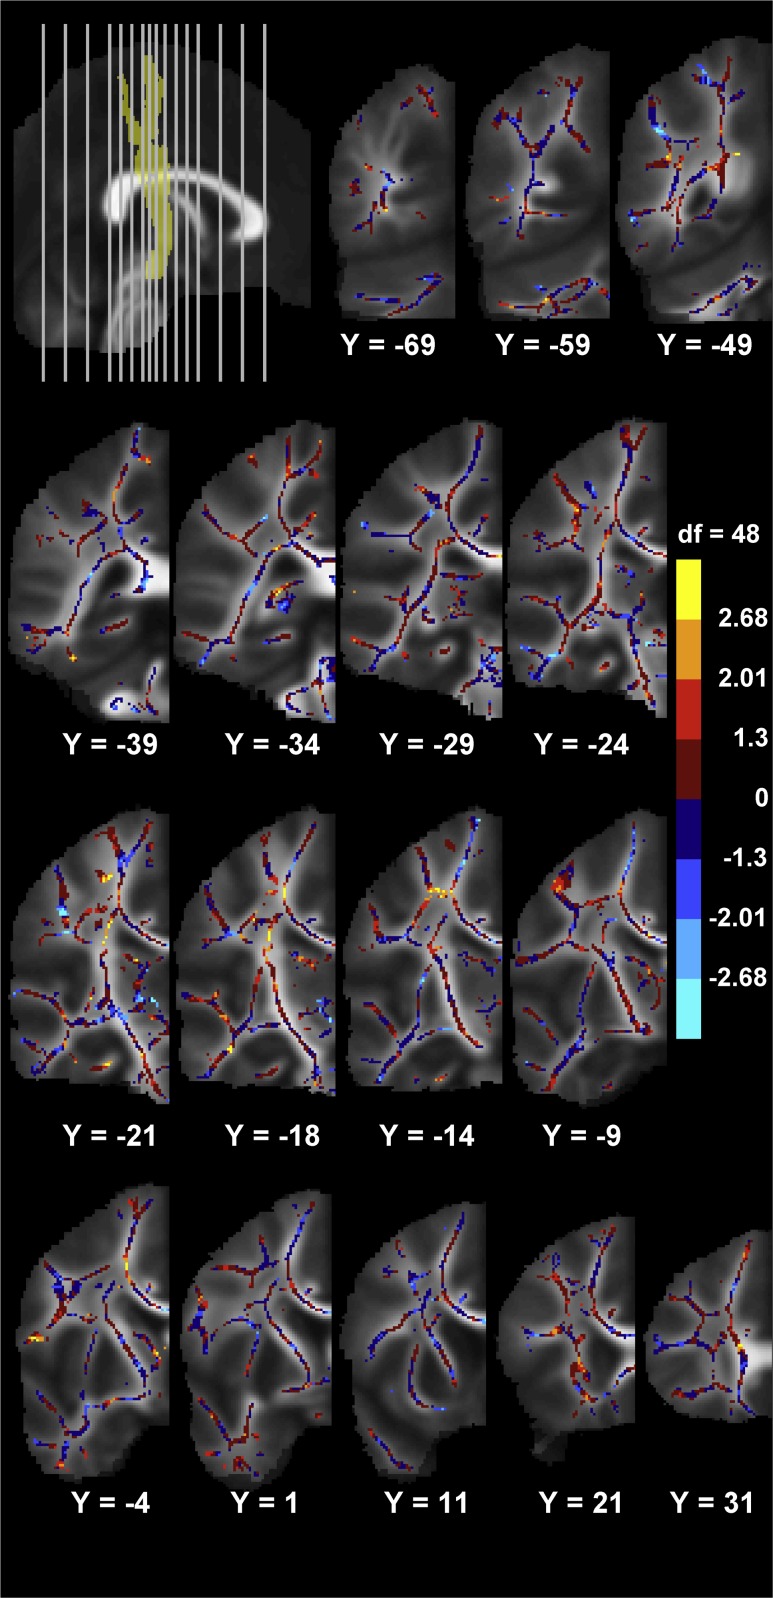
Fig. 7.
Effect-size map of the association between the circle drawing laterality index LICV and the right–left voxel-wise difference in FA-values, corrected for age and gender. The effect-size map is overlaid on the mean symmetric FA images. Only one hemisphere is visualized as a difference score is investigated. The association of higher right–left voxel-wise FA difference with better right-to-left circle drawing performance is shown in warm colors. Negative values are shown in cool colors. The color bar shows the color mapping of all skeleton voxels to the values of the uncorrected t-statistics (t = 0, p = 1; t = ± 1.229, p = 0.2; t = ± 2.01, p = 0.05; t = ± 2.682, p = 0.01). The MNI coordinates for the coronal images are given under each image. In the upper left corner the position of the coronal slices shown are depicted on the mid-sagittal image with the position of the CST schematized. Coronal slice −69 is displayed to the far left and 31 to the far right on the mid-sagittal image

