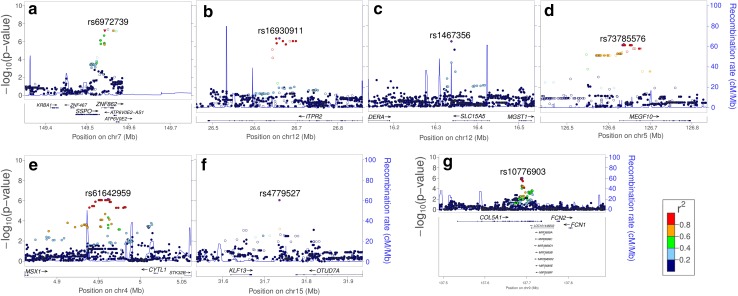
Fig. 3.
Locus-specific plots highlighting the gene(s) represented by SNPs reaching a genome-wide significance threshold of meta P value ≤10−6 for processing speed. a–f Each plot shows the −log10 P value (Y-axis) of SNPs (localized in the genic region) arranged according to their chromosomal positions (X-axis). The locus-specific plots include the genes SSPO, ZNF862 and ATP6V0E2 (a), ITPR2 (b), SLC15A5 (c), MEGF10 (d), KLF13 (f), and COL5A1 (g). The blue lines show estimated recombination rates calculated from the HapMap data. The arrows represent the genomic locations of genes based on the NCBI Build 37 human assembly. SNP color represents LD with the SNP showing highest association in the locus. The SNP annotation is represented as follows: circles no annotation; squares synonymous or 3′ UTR; triangles non-synonymous; asterisks TFBScons (in a conserved region predicted to be a transcription factor binding site); squares with an X, MCS44 placental (in a region highly conserved in placental mammals)

