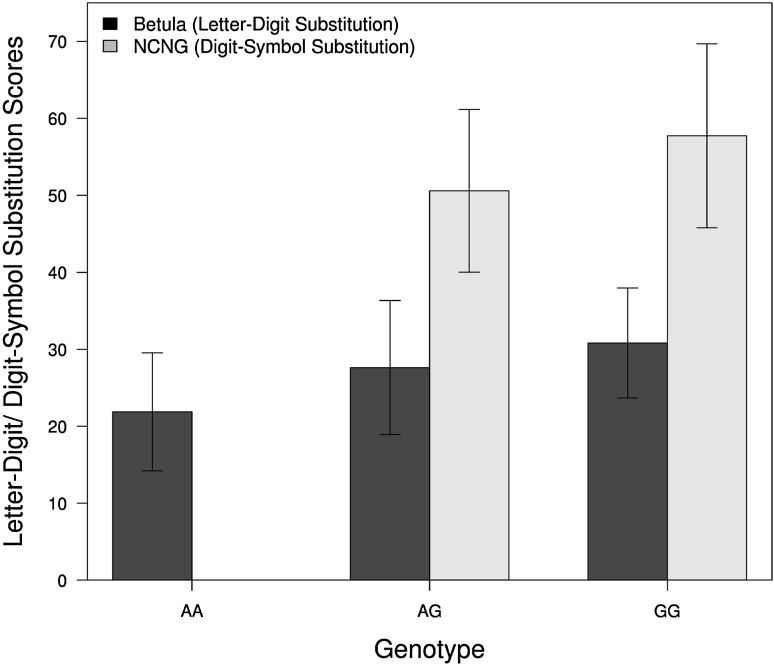
Fig. 4.
Genotype means for the processing speed task measures in the Betula and NCNG samples for the SNP rs6972739. The X-axis shows the three genotypes and the Y-axis represents scores from the letter digit substitution and digit symbol substitution tests in Betula and NCNG samples, respectively. Error bars indicate one standard deviation from the mean. Number of individuals in each sample that were used to generate the plots: N = 360 for Betula and N = 220 for NCNG

