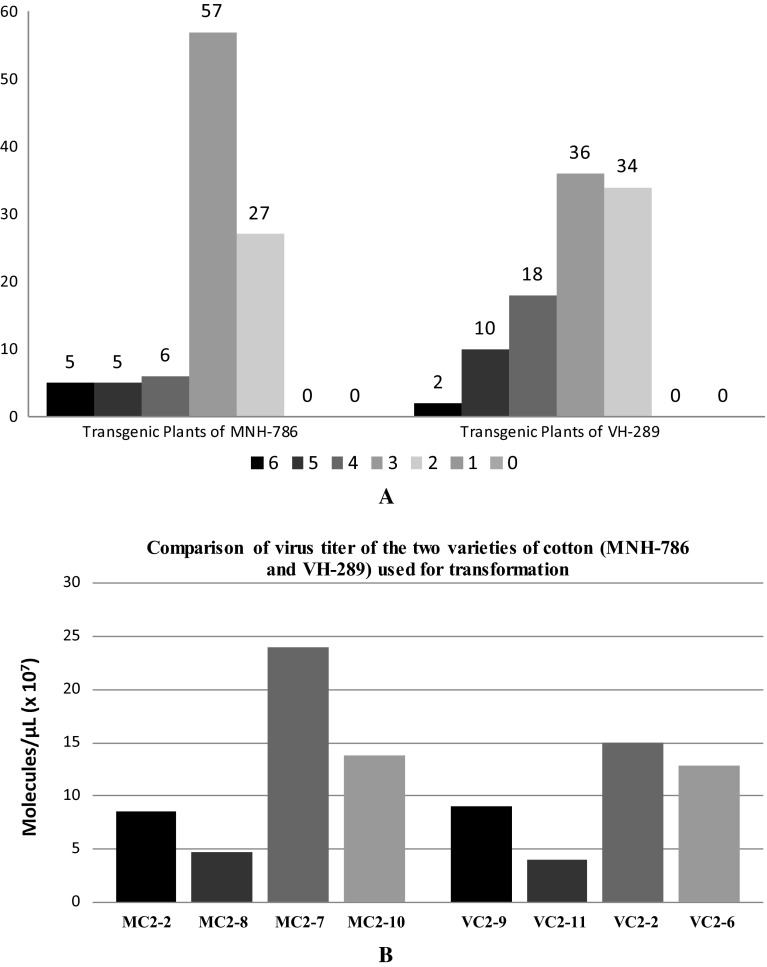
Fig. 8.
a Comparison of disease index of the two varieties of cotton (MNH-786 and VH-289) used for transformation. Y-axis is showing number of plants, while X-axis is showing different disease ratings (0–6) as per Table 4. b Comparison of virus titer of the two varieties of cotton (MNH-786 and VH-289) used for transformation. Y-axis is showing virus titer in terms of molecules/µl × 107, while X-axis is showing transgenic plants, MC2-2, MC2-8, MC2-7, and MC2-10 of MNH-786 and VC2-9, VC2-11, VC2-2, and VC2-6 of VH-289

