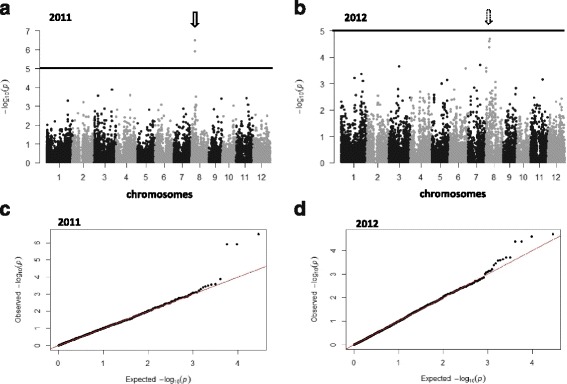
Fig. 2.

Manhattan plots of the markers associated with rice blast disease resistance in the indica panel in Andranomanelatra in a) 2011 and b) 2012. X axis show markers along the 12 rice chromosomes and Y axis shows the negative log10-transformed p-values for each association. Q-Q plots of the markers associated with rice blast disease resistance in the indica panel in Andranomanelatra in c) 2011 and d) 2012. Full line: P = 1.10−5
