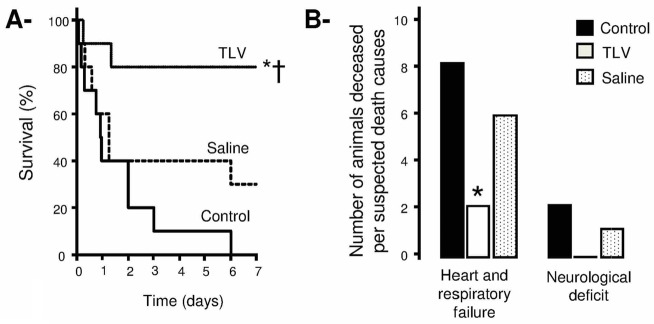
Figure 4.
Panel A: Kaplan-Meyer survival curves throughout the 7 days following coronary artery occlusion and cardiac arrest in the different experimental groups.
Panel B: Number of animals deceased before 7 days of survival follow-up in each group, according the suspected cause of death (cardiogenic vs neurological death).
See legend of Figure 2.

