Figure 6.
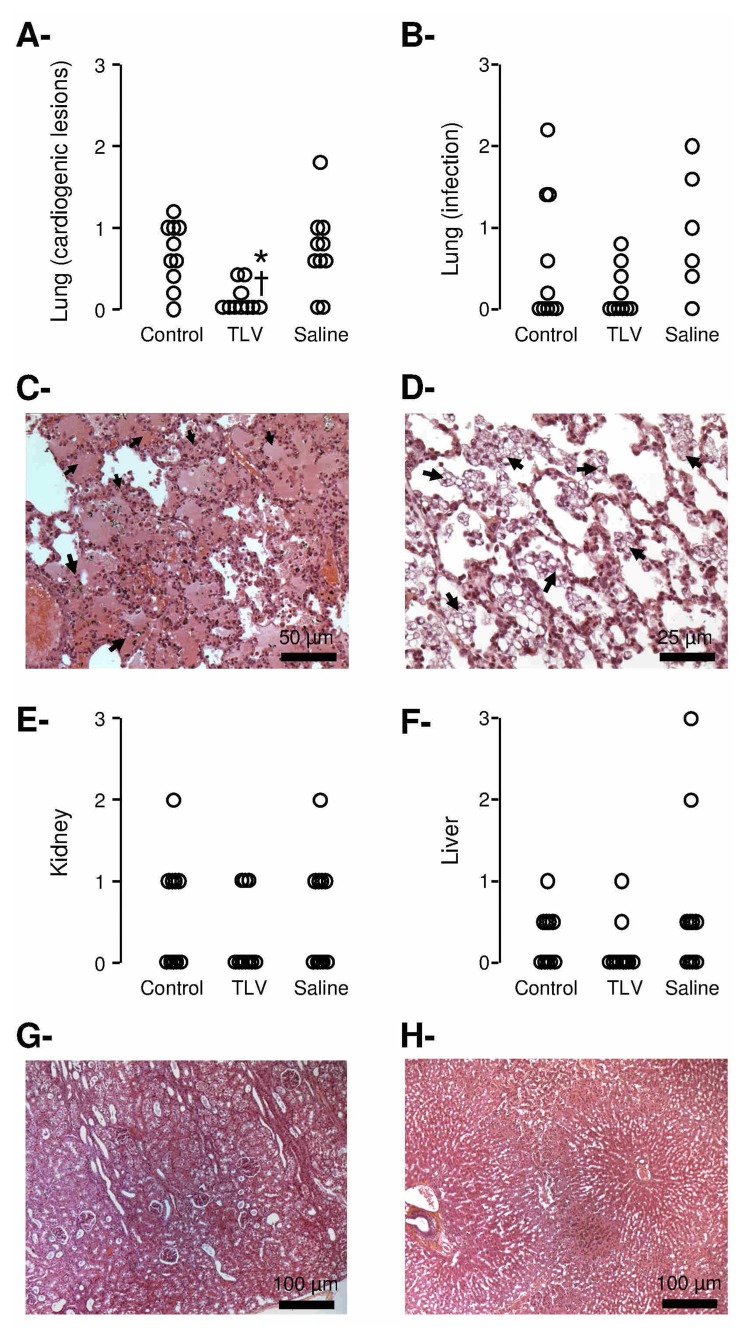
Panel A and B: Histopathological scores of cardiogenic lesions and infectious complications in the lungs, respectively. Open circles represents individual scores.
Panel C: Histopathological appearance of the lung of a rabbit in the Control group. Lesions consisted of extensive serous edema within the alveolae (arrows).
Panel D: Histopathological appearance of the lung of a rabbit in the TLV group. Foam macrophages can be seen within the alveolae (arrows).
Panels E and F: Histopathological scores of alteration of the kidney and liver, respectively. Open circles represents individual scores.
Panel G: Histopathological appearance of the kidney in the Control group. Lesions consisted of mildly dilated proximal tubules.
Panel H: Histopathological appearance of the liver of a rabbit in the Control group. Lesions consisted of systematized centrilobular congestion of the sinusoids.
See legend of Figure 2.

