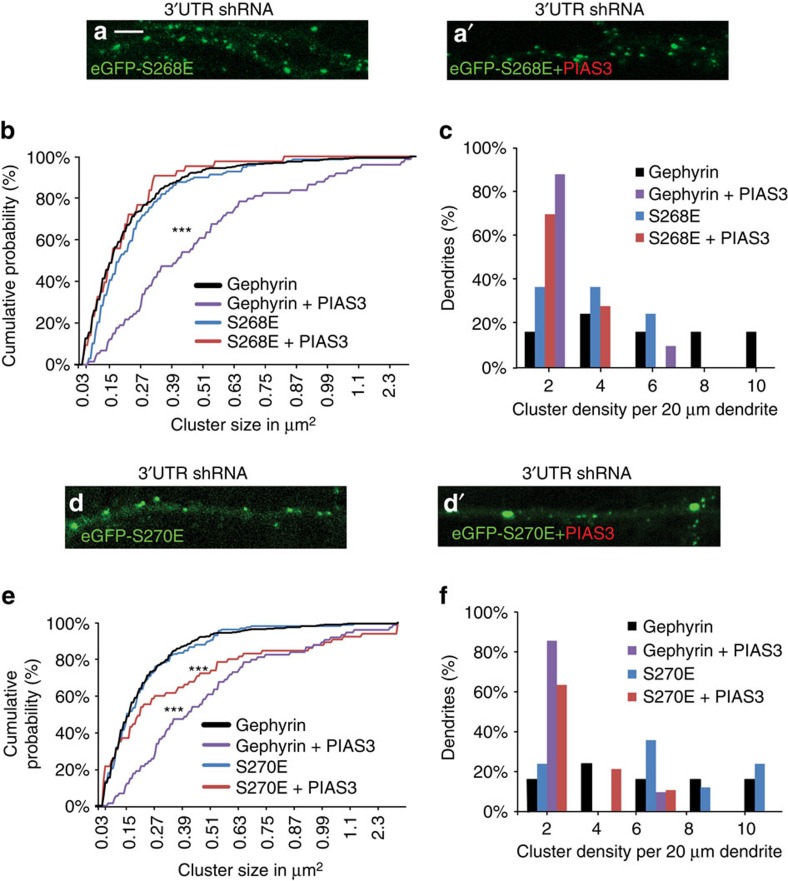
Figure 4. Morphology of ERK1/2 phosphorylation mimicking eGFP–S268E gephyrin mutant in neurons co-transfected with myc–PIAS3 (DIV 8+7).
(a,b) Cumulative probability distribution of eGFP clusters in the presence of myc–PIAS3 shows that phosphorylation at S268 blocks PIAS3-mediated cluster growth. (c) Synaptic cluster density distribution in neurons co-expressing myc–PIAS3 shows that gephyrin phosphorylation at S268 cannot prevent PIAS3-mediated reduction in cluster density. (d,d') Morphology of GSK3β phosphorylation mimicking eGFP–S270E gephyrin mutant in neurons co-transfected with myc–PIAS3 (DIV 8+7). (e) Cumulative probability distribution of eGFP clusters in neurons expressing myc–PIAS3 shows that phosphorylation at S270 does not block PIAS3-mediated size growth. (f) Synaptic cluster density distribution in neurons co-transfected with myc–PIAS3 shows significant reduction compared to eGFP–S270E alone control cells. Scale bar, 5 μm. Images from three independent experimental replicates were analysed; error bars are s.e.m.

