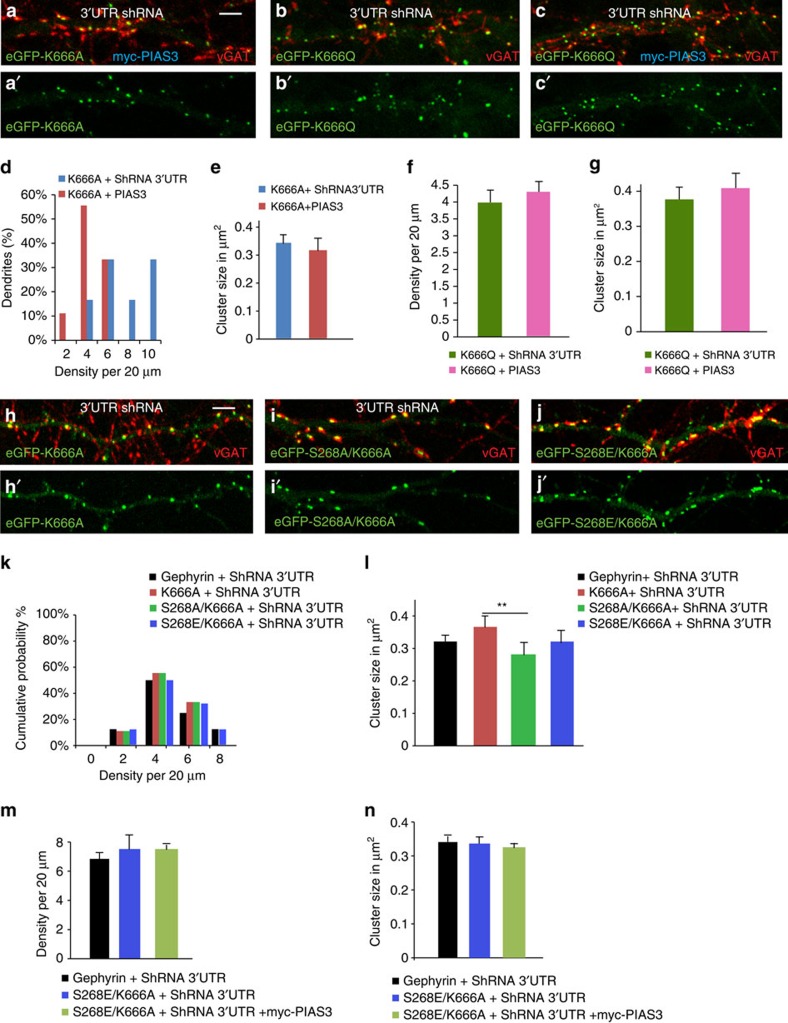
Figure 6. Cellular signalling pathways crosstalk.
(a–c') Morphology of neurons transfected with eGFP–K666A, eGFP–K666Q and 3′-UTR shRNA with or without myc–PIAS3. (d) Quantitative analysis shows cluster density distribution in neurons co-expressing eGFP–K666A and myc–PIAS3 is significantly decreased. (e) Mean gephyrin cluster size in neurons co-expressing eGFP–K666A and myc–PIAS3 shows no change. (f,g) eGFP–K666Q cluster density and cluster size is not altered in the presence of myc–PIAS3. (h–j') Morphology of eGFP–K666A, eGFP–S268A/K666A or eGFP–S268E/K666A transfected neurons (DIV 8+7). (k) Synaptic cluster distribution shows no change in cluster density in neurons transfected with eGFP–K666A, eGFP–S268A/K666A or eGFP–S268E/K666A mutants. (l) Mean cluster size are not different between eGFP–gephyrin and eGFP–K666A and eGFP–K666A/S268A; mean cluster size is reduced between eGFP–K666A and eGFP–S268A/K666A. (m,n) myc–PIAS3 co-expression does not alter eGFP–S268E/K666A mutant phenotype. Scale bar, 10 μm. Images from atleast five independent experimental replicates were analysed; error bars are s.e.m.

