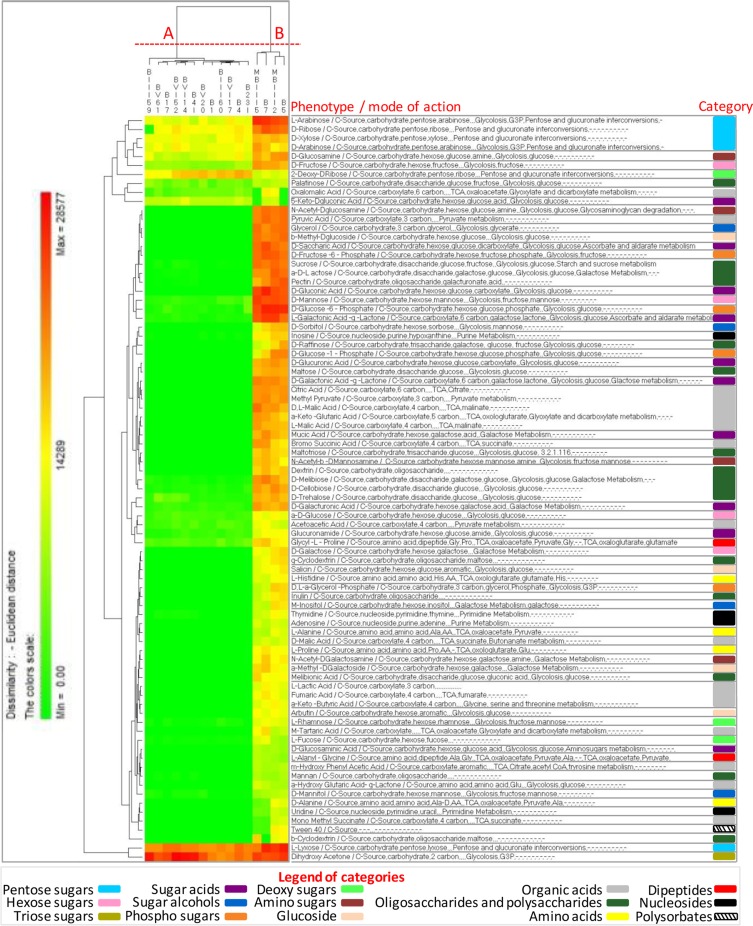
FIG 2.
Pseudo-heat map showing the phenotypes of fructophilic lactic acid bacteria (FLAB) strains during growth in fructose-yeast extract-polypeptone (FYP) broth incubated anaerobically at 30°C for 36 h. Each phenotype profile was assayed for growth in the presence of 190 carbon sources using the OmniLog phenotypic microarrays. The color scale shows the cellular respiration activity, evaluated through the OmniLog automated incubator/reader (Biolog) as the area of a region bounded by a color development time series. Sources not listed have not been consumed by any of the strains. Phenotype categories are differentiated with different colors.

