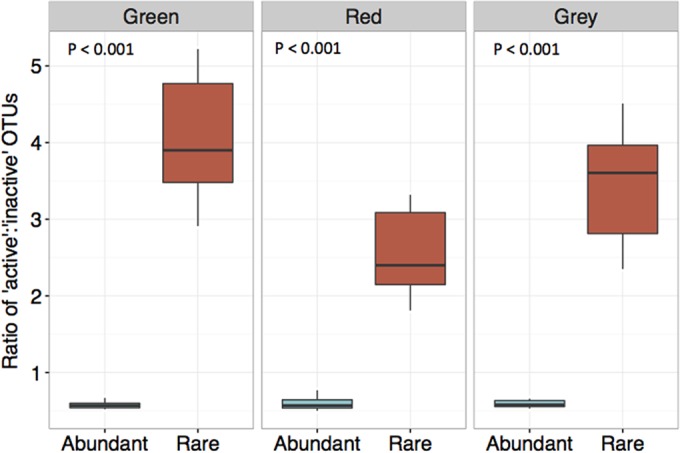
FIG 6.

Rare OTUs have a significantly higher ratio of ‘active’ to ‘inactive’ OTUs under green-, red-, and gray-phase trees. Abundant versus rare groups were delineated by applying a 20% threshold according to the bulk community rank. P values are indicative of a significant difference between the active/inactive ratios of abundant and rare OTUs under each respective phase.
