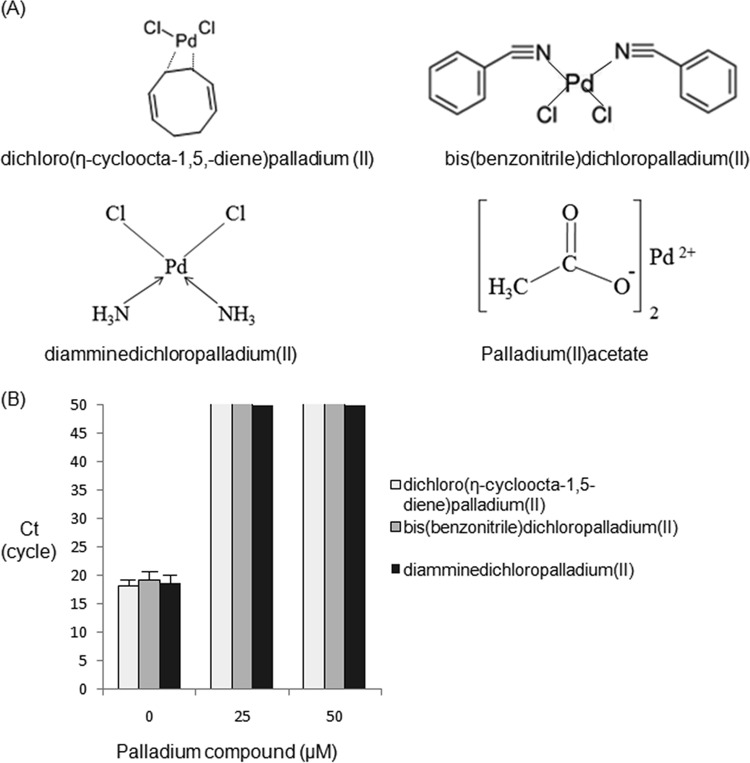
FIG 1.
Listed Pd compounds and the qPCR elongation of purified C. sakazakii chromosomal DNA exposed to Pd compounds in vitro. (A) Chemical structures for Pd compounds. (B) Effects of Pd compounds on purified C. sakazakii DNA in vitro. The qPCR procedure (50 cycles) was performed in duplicate, and the CT values are presented as means ± standard deviations (SD) in the bar graph (n = 2). The light-gray (close to white), gray, and black bars terminating at a CT value of 50 on the y axis indicate that no qPCR amplification occurred above that level.

