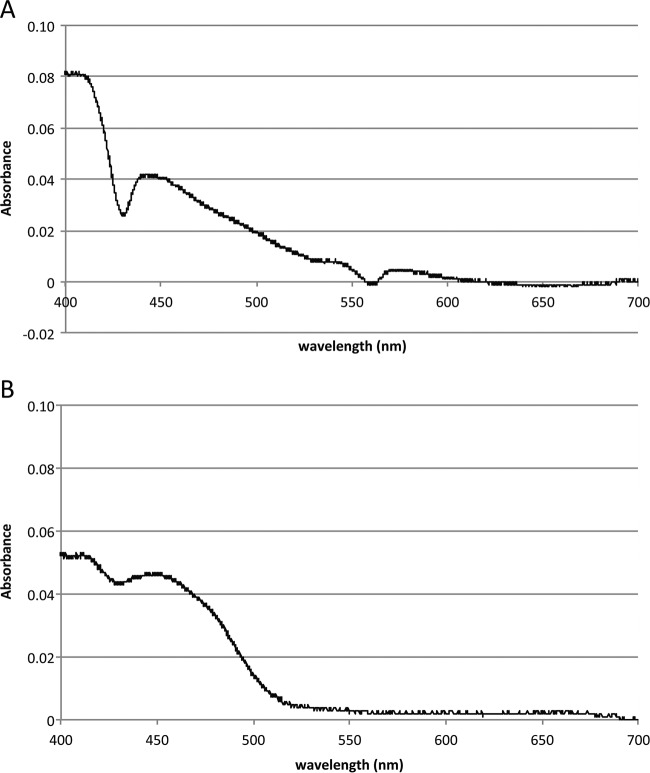
FIG 5.
Cytochrome bd complex of A. muciniphila. (A) Spectrum of A. muciniphila cell extract. The spectrum data show the oxidized spectrum minus the dithionate-reduced spectrum. (B) Spectrum of E. coli ECOM4-AmuCytbd cell extract minus the ECOM4 cell extract spectrum. The baseline is set for absorbance at 700 nm. The two spectra show similar patterns at 430 nm.

