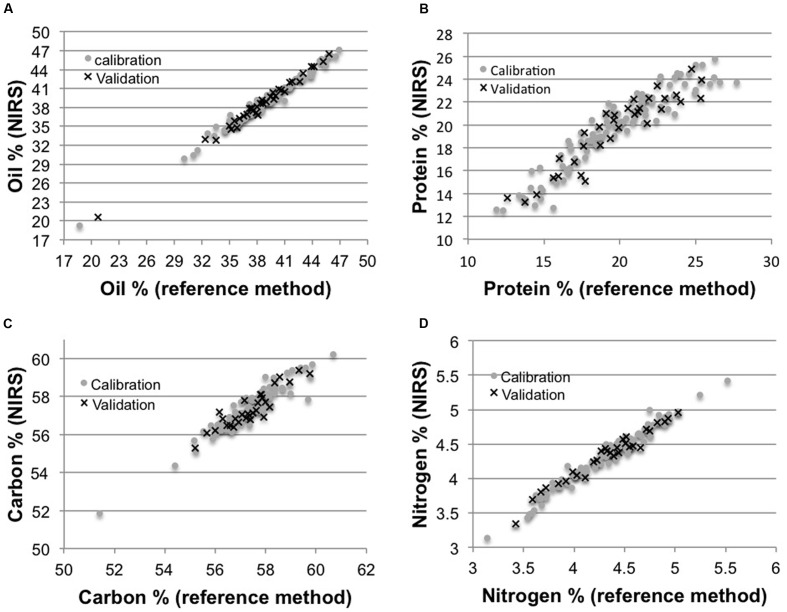
FIGURE 1.
Regression curves between near-infrared reflectance spectroscopic (NIRS) and reference methods for oil, protein, carbon, and nitrogen content. Scatter plots of NIRS versus reference method values for oil % (A), protein % (B), carbon (C), and nitrogen (D) in the calibration and validation sets.

