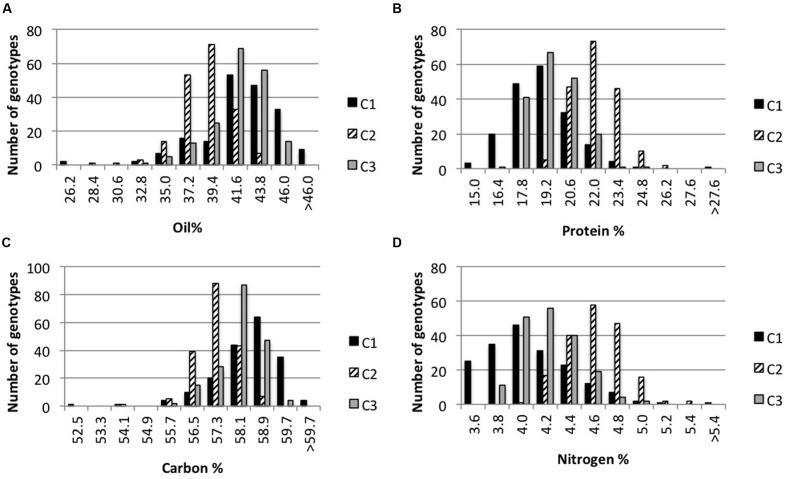
FIGURE 3.
Frequency distribution of seed oil, protein, carbon, and nitrogen content in three independent cultures. Frequency distributions of oil (A), protein (B), carbon (C), and nitrogen (D) content mean values for 183 genotypes (n = 3) corresponding to Arabidopsis accessions and RILs from eight populations. The same genotypes were cultivated in three independent cultures (C1, C2, C3).

