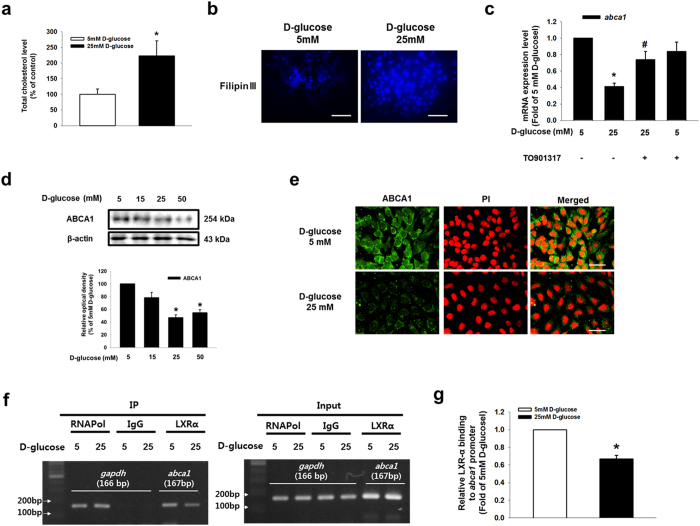
Figure 5. Role of high glucose-reduced LXRα in ABCA1 expression and cholesterol accumulation.
(a) Total cholesterol level is measured by using cholesterol detection kit described in Materials & Methods. Data are presented as a mean ± S.E. of three independent experiments of duplex dishes. (b) Intracellular cholesterol was stained with fillipinIII, and visulalized by confocal microscopy. Scale bars, 50 μm (magnification, ×800). (c) TO901317 (1 μM) pretreated to SK-N-MC prior to D-glucose treatment. Total mRNA expressions of abca11 and β-actin were analyzed by quantitative real-time PCR. The mRNA expression level was normalized by β-actin mRNA expression level. Data are presented as a mean ± S.E. of three independent duplex dishes. (d) ABCA1 and β-actin expressions were detected by western blotting. (e) Cells were immunostained with ABCA1 and PI. Scale bars, 50 μm (magnification, ×800). (f) DNA was immunoprecipitated with RNA polymerase, IgG and LXRα antibodies. The immunoprecipitation and input samples were amplified with primers of gapdh and abca1 gene promoters. (g) CHIP data was quantified by real time PCR of two independent experiments of triple dishes. Each western blot image is representative of three independent experiments. Data are presented as a mean ± S.E. *p < 0.05 versus 5 mM of D-glucose treatment, #p < 0.05 versus 25 mM of D-glucose treatment. All western blot data were cropped and acquired under same experimental conditions.

