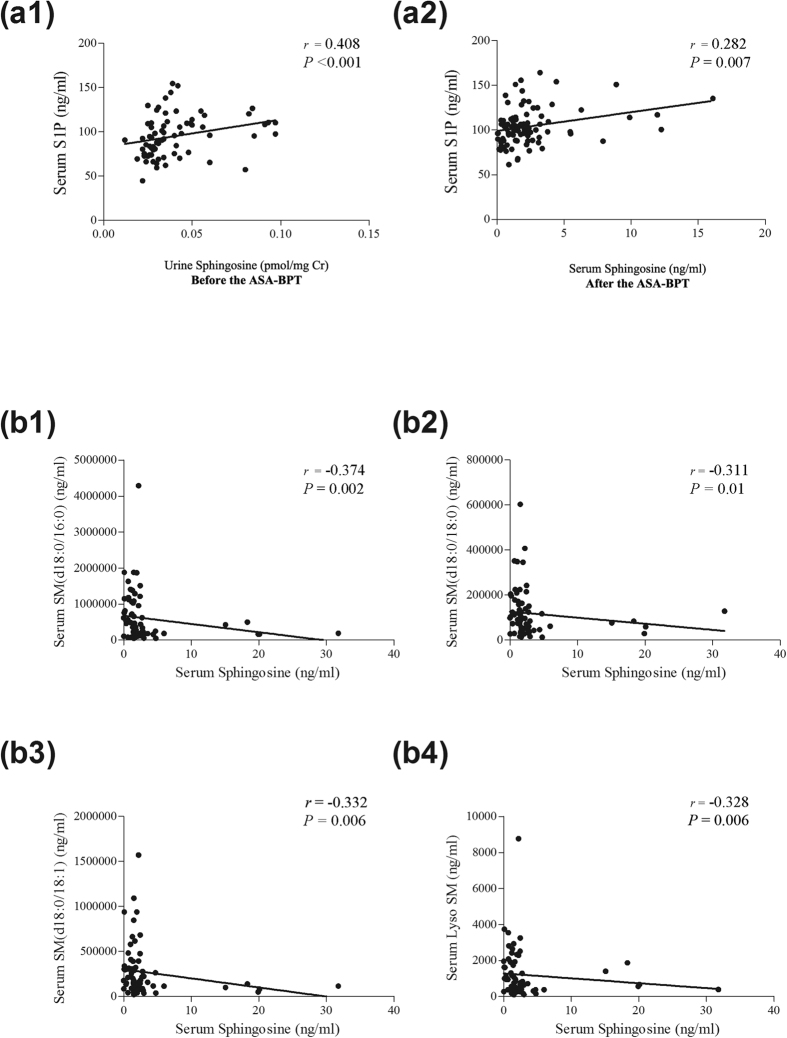
Figure 4. Correlation between the SL metabolite levels.
(a) Positive correlation of (a1) serum S1P and urine sphingosine at the basal status before the ASA-BPT, (a2) serum S1P and serum sphingosine at onset of reaction symptoms following the ASA-BPT. (b) Negative correlation of serum sphingosine level at the basal status with (b1) serum SM (d18:0/16:0), (b2) with serum SM (d18:0/18), (b3) with serum SM (d18:0/18:1), (b4) with serum LysoSM before the ASA-BPT.

