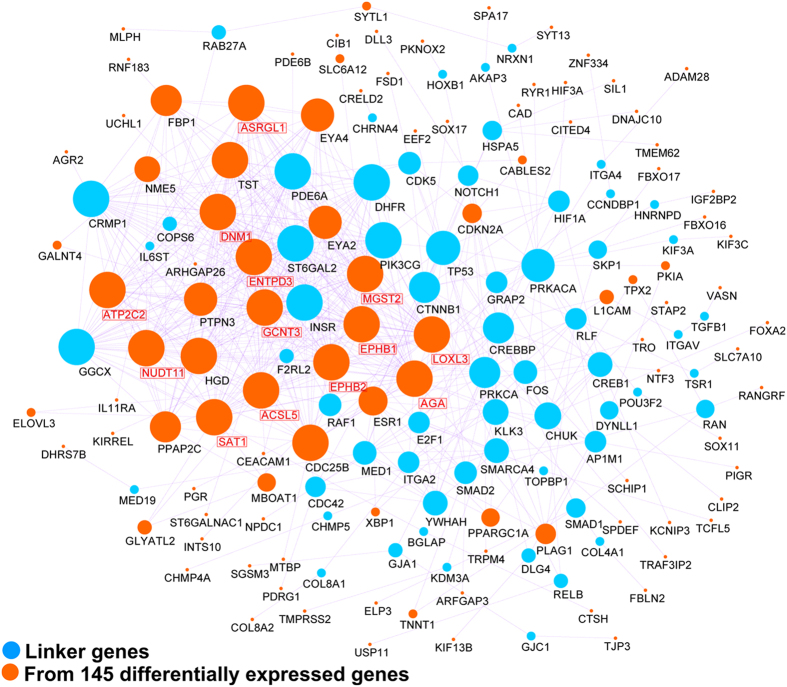
Figure 3. Network reconstruction and mutation analysis of the 145 most significantly differentially expressed genes between EEC and NEEC.
(A) Reconstructed network using protein-protein interaction data. Genes shown in orange (n = 106) are from the 145-gene list. The remaining genes in blue (n = 62) are linker genes that bridge the 106 genes into the network. Hub genes have been denoted with red text and boxes. EEC - endometrioid endometrial cancer; NEEC - non-endometrioid endometrial cancer.

