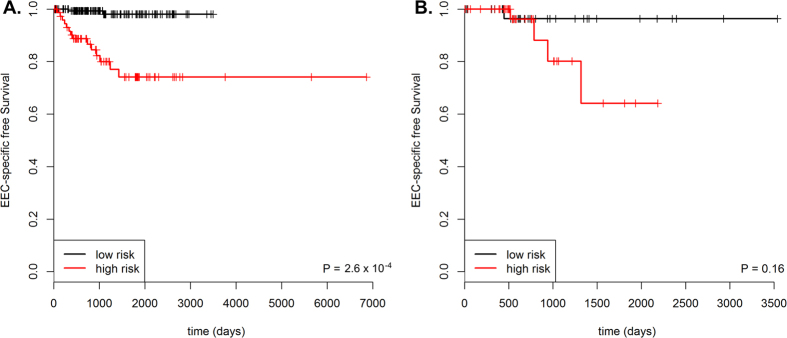
Figure 4. Kaplan-Meier plots for EC-specific survival for high- and low-risk EEC patient groups identified using 31-gene prognostic signature.
(A) 241 samples with RNA-Seq data generated by the Illumina GA platform from the TCGA. (B) 92 samples with RNA-Seq data generated by the Illumina HiSeq platform from the TCGA. EEC - endometrioid endometrial cancer; TCGA - The Cancer Genome Atlas; EC-specific survival - endometrial cancer-specific survival.

