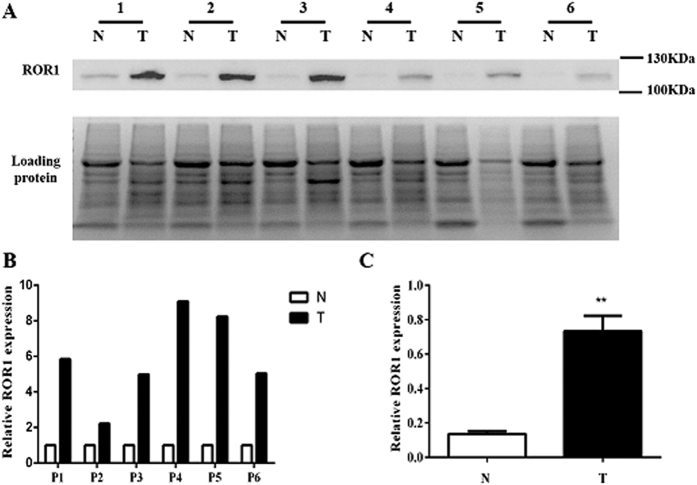
Figure 1. Analysis of ROR1 expression in lung ADC and their adjacent non-tumor tissue samples.
(A) Western blot analysis showed that the lung ADC tissue samples (T) express high level of ROR1 protein while the adjacent non-tumor tissue samples (N) express little ROR1 protein. Total protein levels were used as loading control. The full-length gels of Western blot analysis are presented in Supplementary Figure S1. (B,C) The relative intensity of each panel was calculated by Image J and analyzed by paired t-test. Statistics results showed that the value of P < 0.001.

