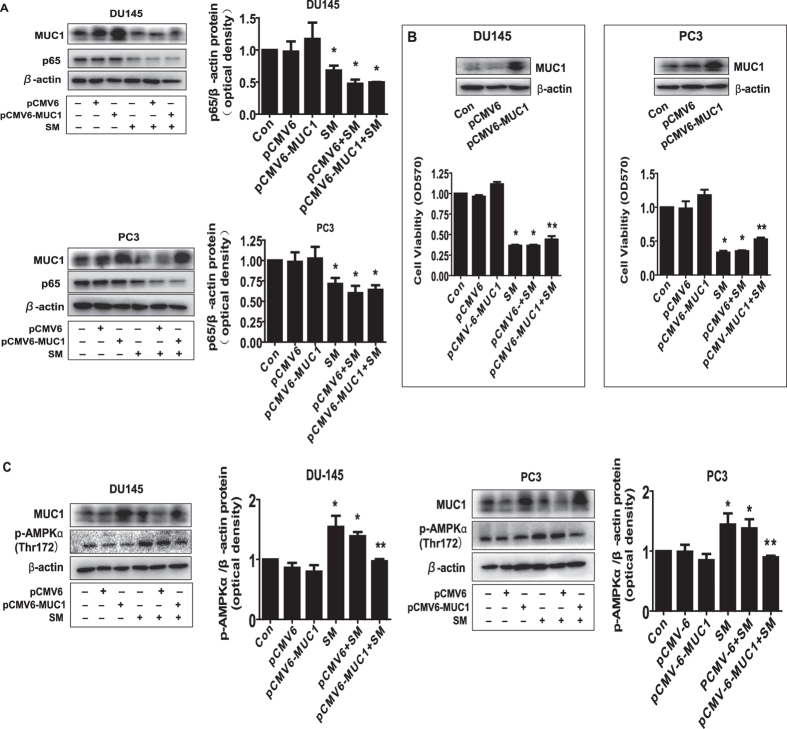
Figure 6. While overexpression of MUC1 had no effect on p65, it attenuated the effect of solamargine on cell growth inhibition and phosphorylation of AMPKα.
(A) PC3 and DU145 cells were transfected with the control (pCMV6) or expression constructs of MUC1 for 24 h before exposing the cells to solamargine (6 μM) for an additional 24 h. Afterwards, p65 and MUC1 protein expression were determined by Western blot. (B) PC3 and DU145 cells were transfected with the control (pCMV6) or expression constructs of MUC1 for 24 h before exposing the cells to solamargine (6 μM) for an additional 48 h. Afterwards, the cell viability was determined using the MTT assay as described in the Materials and Methods Section. Insert on the upper panel represented the protein levels of MUC1 as determined using Western blot. GAPDH was used as internal control. (C) PC3 and DU145 cells were transfected with the control (pCMV6) or expression constructs of MUC1 for 24 h before exposing the cells to solamargine (6 μM) for an additional 8 h. Afterwards, p-AMPKα and MUC1 protein were determined by Western blot. The figures are representative cropped gels/blots that have been run under the same experimental conditions. Values in bar graphs were given as the mean ± SD from three independent experiments performed in triplicate. *Indicates significant difference as compared to the untreated control group (P < 0.05). **Indicates significant difference from solamargine treated alone (P < 0.05).

