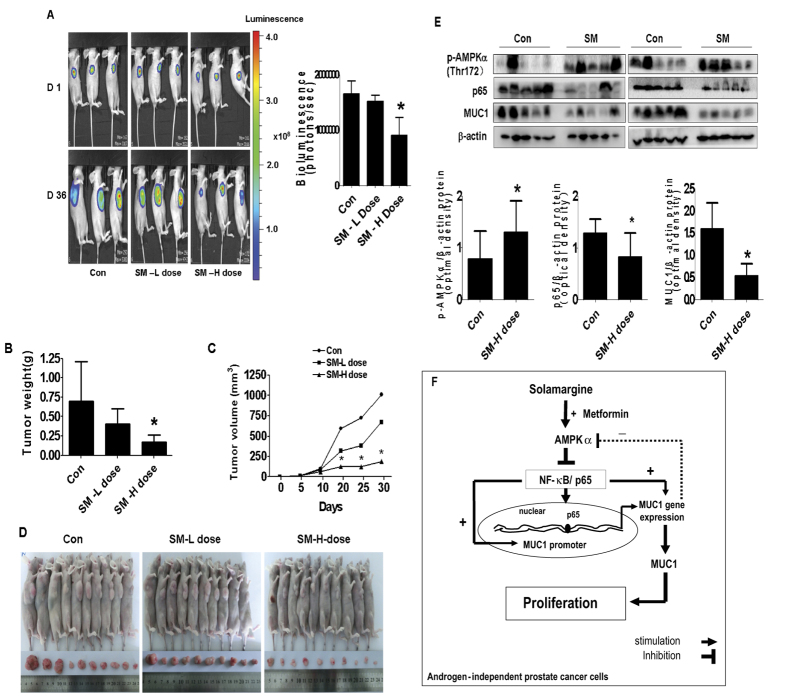
Figure 7. The effect of solamargine treatment in the xenograft mice model.
Mice (n = 10/group) were divided to 3 groups [Con (saline), Low (L, 5 mg/kg) and High (H, 10 mg/kg) doses], and solamargine was given around the 10th day after tumor cells injection by gavages daily for up to 30 days. (A) The xenografts were assessed by in vivo bioluminescence imaging at the end of the experiments (on day 30). The tumor growth was monitored by injecting luciferin in the mice followed by measuring bioluminescence using IVIS Imaging System. Imaging and quantification of signals were controlled by the acquisition and analysis software living image as described in the Materials and Methods section. Representative images are shown. (B,C) The xenografts were harvested on day 36, and the volume and weight of tumors were measured. The bar graphs represented the tumor weight and volume of mice results of as mean ± SD from three independent experiments. (D) The photographs of solamargine or vehicle-treated xenografts derived from nude mice are shown. (E) At the end of the experiments, xenograft tumors were isolated from individual animals and the corresponding lysates were processed for detecting p65, MUC1 and p-AMPKα by Western blot. GAPDH was used as loading control. Values in bar graphs were given as the mean ± SD from three independent experiments *Indicates the significant difference from untreated control (p < 0.05). (F) The diagram shows that solamargine inhibits the growth of androgen-independent prostate cancer cells through AMPKα-mediated inhibition of p65, followed by reducing expression of MUC1 gene. There is a synergy of solamargine and metformin. The feedback regulatory loop of AMPKα signaling pathway further demonstrates the critical role of MUC1 in contributing to the overall responses of solamargine.

