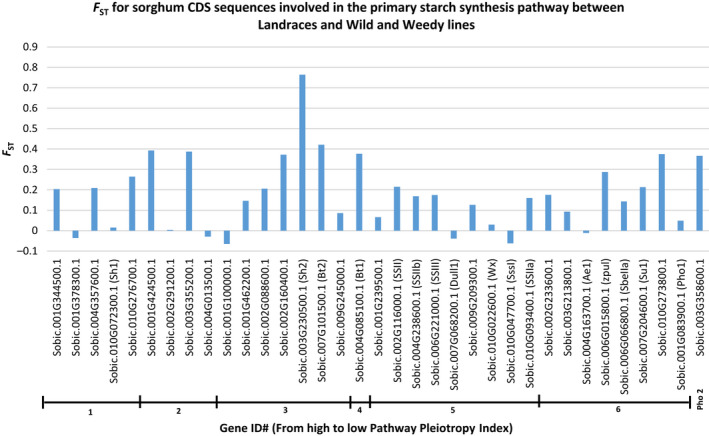
Figure 4.

The F ST of CDS sequence and genes of the primary Starch Synthesis Pathway of sorghum. F ST value comparisons are shown between sorghum groups ‘Landraces’ and ‘wild and weedy’. Genes are sorted according to Pathway Pleiotropy Index (PPI; Ramsay et al., 2009).
