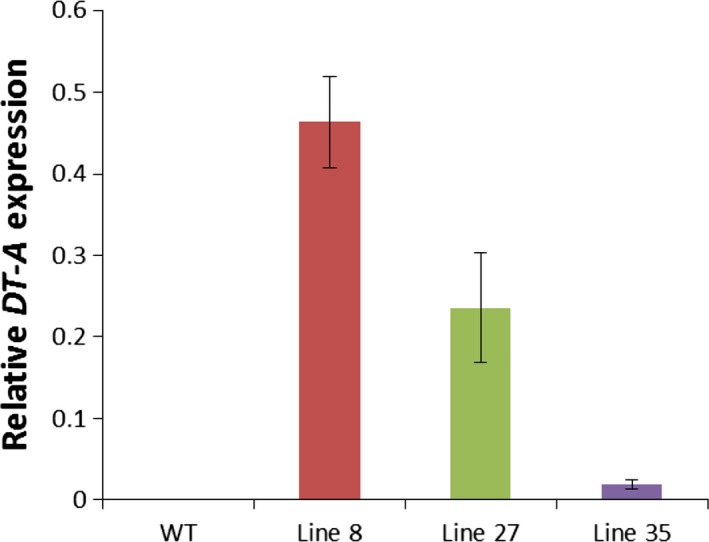
Figure 3.

Relative expression levels of the DT‐A gene in the 0.7‐mm floral buds (floral stage 6) of three representative rPTAG2I::DT‐A tobacco plants, showing that the severity of the floral phenotype correlated with the level of the DT‐A gene expression. WT: wild‐type buds; Line 8: flowerless buds from rPTAG2I::DT‐A‐Line 8; Line 27: neuter buds from rPTAG2I::DT‐A‐Line 27; Line 35: carpel‐less buds from rPTAG2I::DT‐A‐Line 35. Expression levels of the tobacco elongation factor 1α gene in each biological replicate were used as an internal reference (Schmidt and Delaney, 2010). Data represent means from three independent biological replicates. Bars show standard errors.
