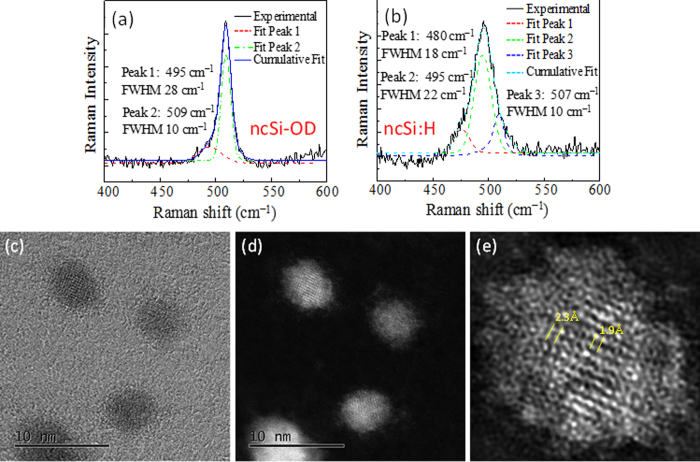
Figure 4.
Raman scattering spectra of (a) ncSi-OD and (b) ncSi:H. Graphs (a,b) show the fitting of amorphous, intermediate (or under-coordinated) atomic configurations, and crystalline components of ncSi-OD and ncSi:H, respectively. (c–e) STEM images of ncSi:H. From left to right: (c) ABF-, (d) HAADF-, and (e) HAADF-STEM images. (e) A magnified image of the NC positioned at the top-left of the image (d). A low-pass filter was applied to acquire the image (e).

