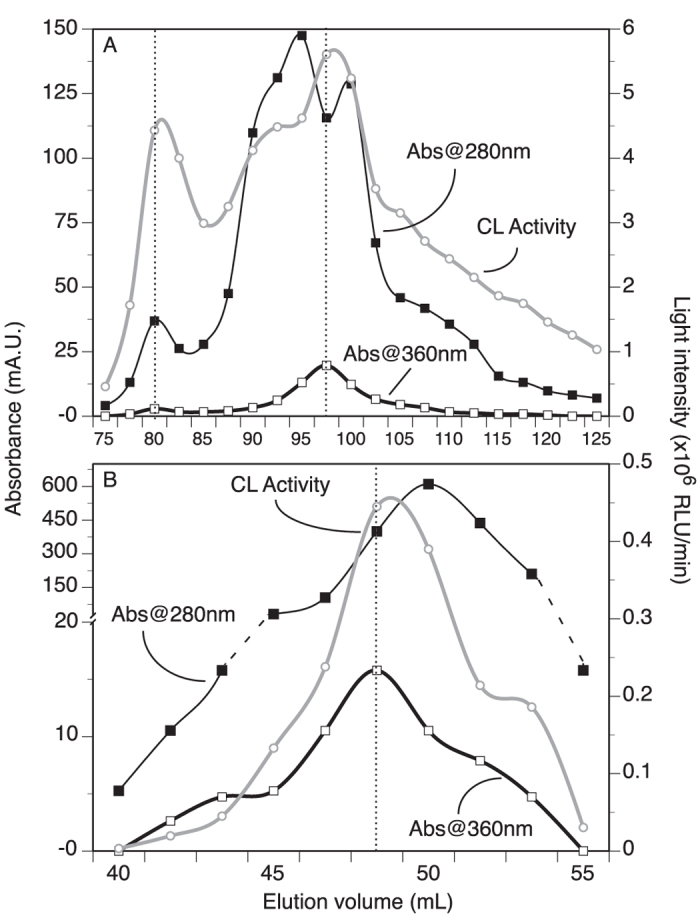
Figure 3. Elution profiles of the Chaetopterus luminous mucus following chromatography, and monitoring of CL activity (following addition of H2O2), A280 nm (general protein) and A360 nm (iron-core specific protein).

(A) Using a HiTrapQ column, fractions with CL activity eluted around 80 mL (less specific front elution) but mainly between 92.5 and 100 mL. (B) Using a Superdex75 column with the most active fractions of the HiTrapQ run, only two fractions showed strong CL activity. In both elution profiles, peak fractions with CL activity corresponded better to A360 nm peak fractions.
