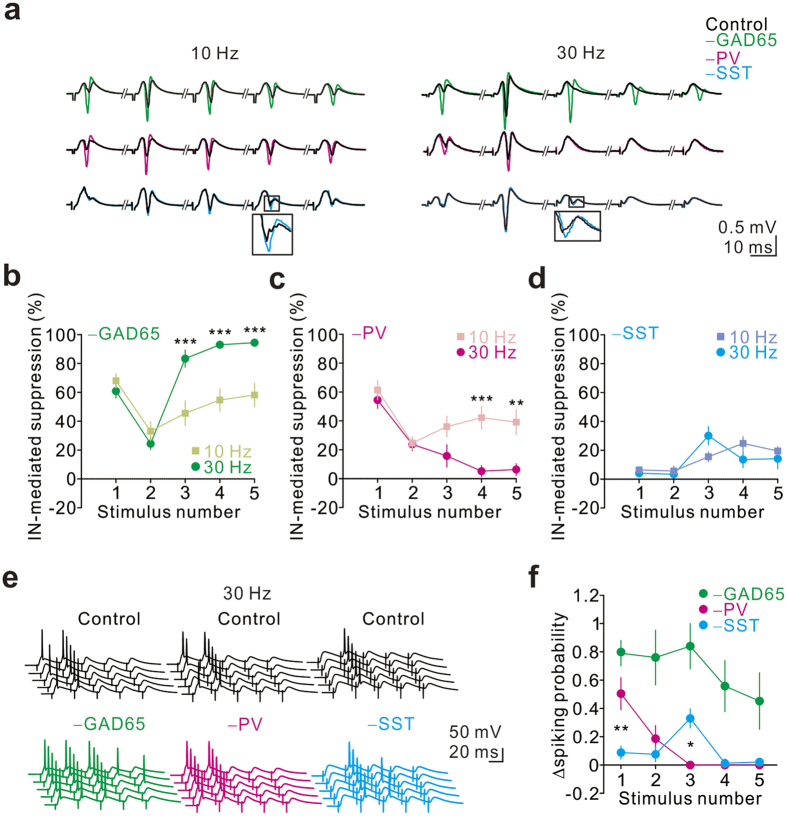
Figure 6. PV+ and SST+ INs differentially shape GC responses to repetitive synaptic input.
(a) From the top to the bottom, pSpikes were evoked by PP stimulation at 10-Hz (left) and 30-Hz (right) trains before (black) and after silencing of GAD65+ (−GAD65, green), PV+ (−PV, magenta), and SST+ (−SST, cyan) INs. Plateau stimulation intensity was used to evoke maximal pSpikes. Amber light was presented during trains. The insets show the enlargement of the traces in the squares. (b)–(d) Summary plots of GAD65+, PV+, and SST+ IN-mediated suppression versus number of stimuli. The degree of IN-mediated suppression (%) was quantified as 100× (pSpike area-IN – pSpike area-Control)/pSpike area-IN. Two-way repeated-measures ANOVA for comparison of 10 Hz versus 30 Hz across multiple numbers of stimuli; post hoc Bonferroni’s test for testing the significance between 10 Hz and 30 Hz at each stimulus number. **P < 0.01, ***P < 0.001. (e) From left to right, whole-cell current-clamp recordings from GCs in response to PP stimulation at near-threshold strength before (top, black) and after optogenetic silencing of GAD65+ (green), PV+ (magenta) or SST+ (cyan) INs. (f) Summary plot of the change in spiking probability of GCs against the number of stimuli following silencing of GAD65+ (green), PV+ (magenta) or SST+ (cyan) INs. For PV+ vs. SST+, *P < 0.05, **P < 0.01.

