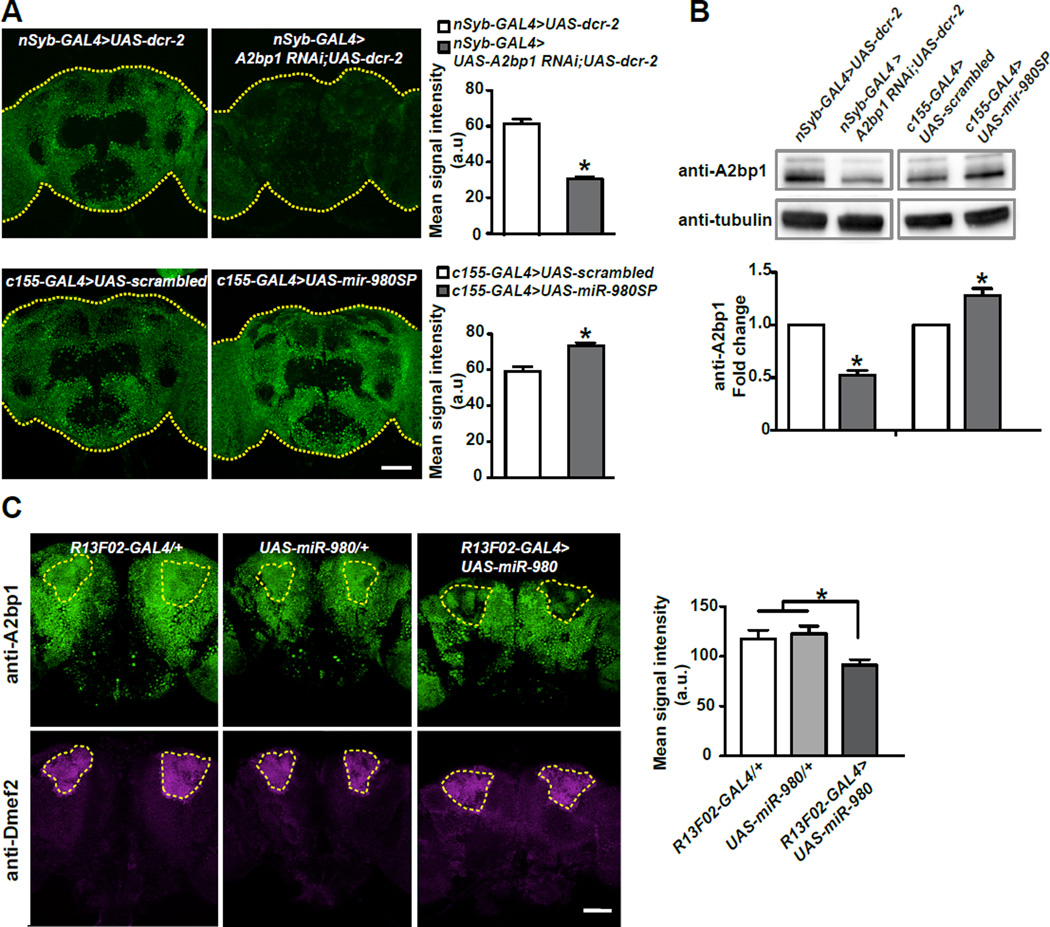
Figure 5. MiR-980 inhibits A2bp1 expression.
(A) Maximum projection images of the central brain from nSyb-GAL4>UAS-dcr-2 and nSyb-GAL4>UAS-A2bp1-RNAi;UAS-dcr-2 flies (top row); and c155-GAL4>scrambled and c155-GAL4>miR-980SP flies (bottom row) stained with anti-A2bp1 antisera. Each brain is outlined with a yellow dotted line. The mean signal intensity from the central brain is quantified in the adjacent histogram. Expression of the A2bp1-RNAi reduced the signal by ~50% compared to the no-RNAi control (n≥11, p<0.0001). Expression of miR-980SP increased the signal by ~25% compared to the scrambled control (n≥20, p<0.0001). Statistics: Data were analyzed by two-tailed, two-sample Student’s t-tests. Scale bar=50µm. Results are the mean ± SEM. a.u.=arbitrary unit.
(B) Representative anti-A2bp1 and anti-α-tubulin western blots using: (1) nSyb-GAL4>UAS-dcr-2, (2) nSyb-GAL4>UAS-A2bp1-RNAi; UAS-dcr-2 (3), c155-GAL4>scrambled and (4) c155-GAL4>miR-980SP fly heads. The signal from the A2bp1 band was first normalized to the α-tubulin signal in its own lane, and then the control samples were normalized to 1.0 to calculate the fold change in the experimental groups. A2bp1-RNAi expression reduced protein levels by ~50% compared to the no-RNAi control. Expression of miR-980SP increased A2bp1 by ~25% compared to the scrambled control. For full sized western blots see Figure S4. Statistics: Data were analyzed by one-sample Student t-test. Results are the mean ± SEM with n=8. p<0.0001 for A2bp1 RNAi and p<0.01 for miR-980SP.
(C) Overexpression of miR-980 in MB represses A2bp1 expression. Single section images of the central brain stained with anti-A2bp1 (green) and anti-Dmef2 (magenta) antibodies. R13F02-GAL4/+ and UAS-miR-980/+ brains were used as controls for the R13F02-GAL4>UAS-miR-980 genotype. MBn as defined by Dmef2 immunoreactivity are outlined with yellow dotted lines and mean signal intensity for the region of interest was measured. Overexpressing miR-980 in MBn decreased the anti-A2bp1 ~25%. Statistics: The data were analyzed by one-way ANOVA followed by Bonferroni’s post-hoc tests. Results are the mean ± SEM with n=15–17. p<0.01. Scale bar=50µm.

