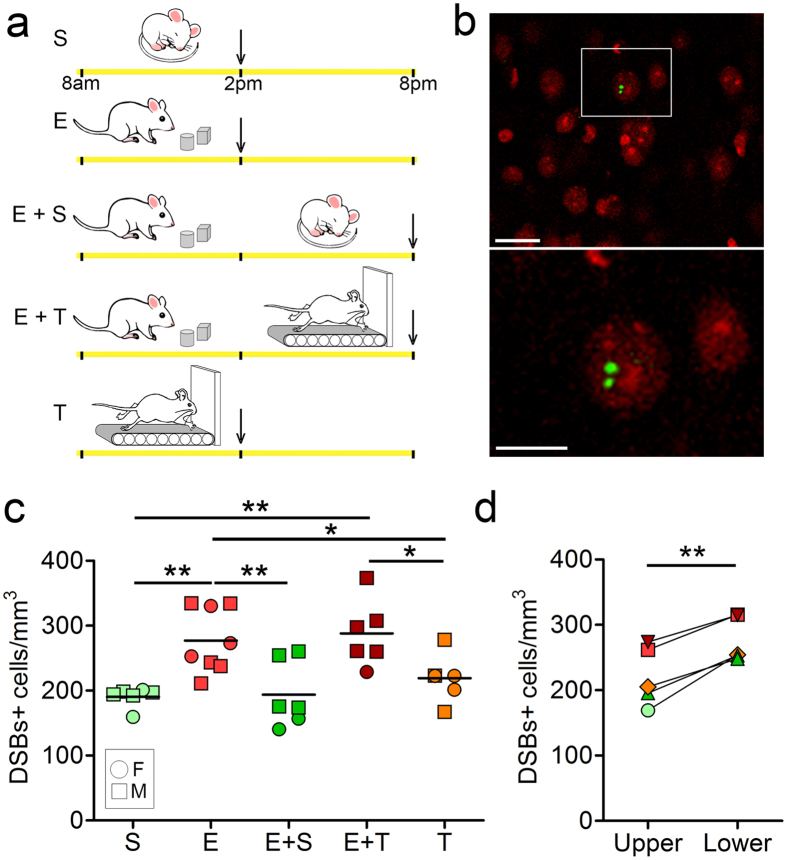
Figure 3. Effects of sleep and wake on DSBs in mouse frontal cortex.
(a) Experimental design. The yellow bar indicates the 12 h light period (8 am–8 pm). Vertical arrows show the time of brain collection. S, sleep; E, exploration; T, treadmill. (b) Examples of nuclear localization of γH2AX positive foci (green) in immunostained sections of frontal cortex in an E mouse. Nuclei are labeled with propidium iodide (PI, red). Scale bars are 10 and 5 μm, respectively. (c) Number of cells containing 1 or more γH2AX positive foci per mm3 of frontal cortex in each of the 5 experimental groups. Each symbol is one mouse (M, male; F, female). (d) Average number of cells with γH2AX positive foci for each experimental group, shown separately for the upper and lower layers of frontal cortex. *p < 0.05; **p < 0.01.

