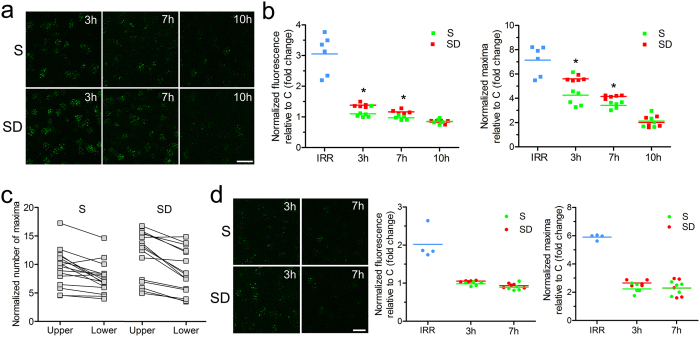
Figure 5. Differential effects of sleep on irradiation-induced DSBs in male and female mice.
(a) Representative microscopic fields from the frontal cortex of post-irradiated sleeping (S) and sleep deprived (SD) male mice killed at different times (3 h, 7 h, 10 h) after light onset. Scale bar = 20 μm. (b) Left and right panels, quantification of γH2AX normalized fluorescence (middle) and maxima (right) in post-irradiated S and SD male mice sacrificed 3 h, 7 h, and 10 h after light onset. *p < 0.05 (c) quantification of γH2AX maxima from the upper and lower layers of the frontal cortex of S and SD male mice. (d) Left panel, representative microscopic fields from the frontal cortex of post-irradiated S and SD female mice killed 3 h and 7 h after light onset. Scale bar = 20 μm. Middle and right panels, quantification of γH2AX fluorescence (middle) and maxima (right) in post-irradiated S and SD female mice killed 3 h and 7 h after light onset.

