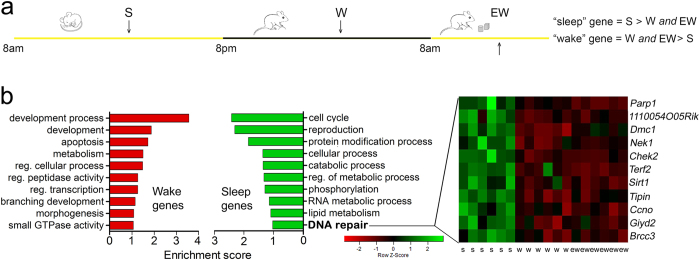
Figure 6. DNA repair genes upregulated in mouse forebrain after sleep.
(a) Experimental groups used to identify sleep and wake genes. (b) Left panel, functional characterization of genes differentially expressed in wake (W + EW > S) and sleep (S > W + EW). A total of 392 unique genes for W + EW and 469 unique genes for S were identified and mapped for functional annotation analysis (DAVID default settings, except for the final group = 5 and multiple linkage threshold = 0.75). Top 10 functional annotation clusters in order of enrichment score are shown for W + EW and S. Right, heat diagram shows the probe set intensity of the DNA repair cluster for each individual S, W, and EW mouse.

