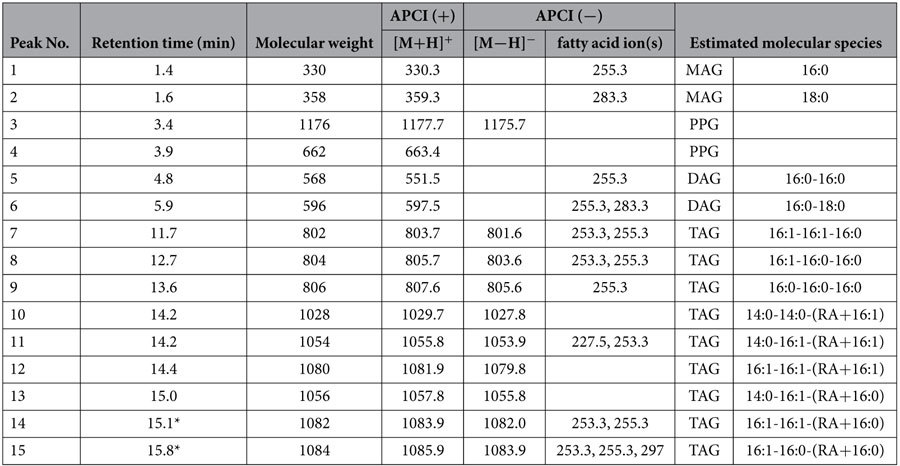
Table 1. Major molecular species from Spot 1 in TLC analysis of Cp4 line shown in Fig. 3 identified by MS/MS analysis.

Individual structures of these lipid molecular species were estimated by the MS/MS analysis. *MS/MS profiiles of peaks at 15.1 and 15.8 min are shown in Fig. 4 as representatives of monoestolide (ME) TAG. APCI, atmospheric pressure chemical ionization; DAG, diacylglycerol; MAG, monoacylglycerol; PPG, polypropyleneglycol; TAG, triacylglycerol.
