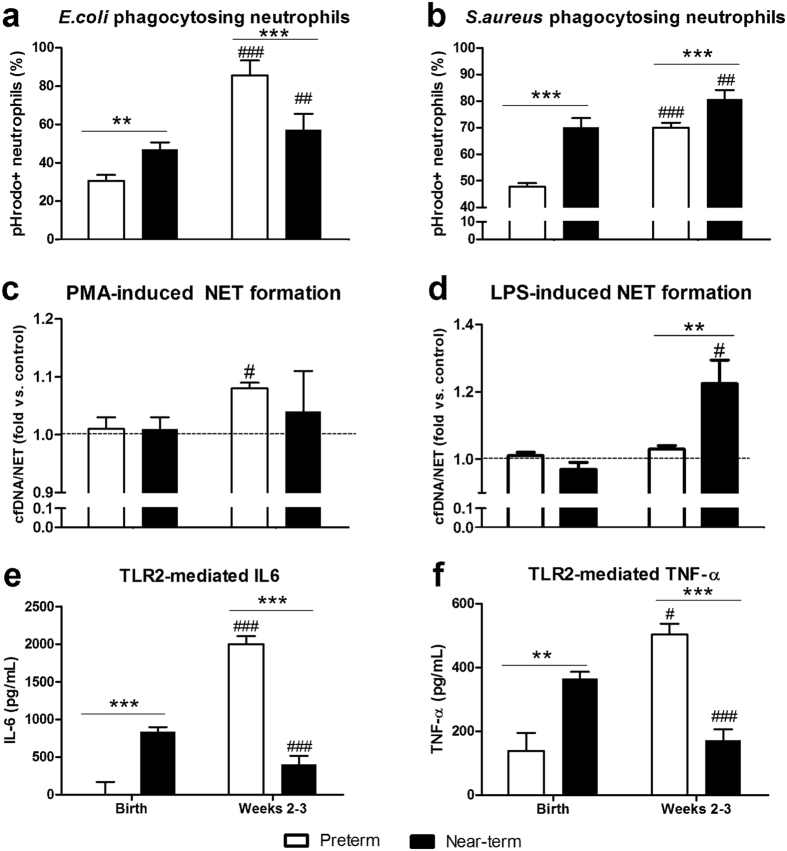
Figure 6. Development of systemic immune responses during the first three weeks of life in preterm and near-term pigs.
(a,b) Proportion of neutrophils exerting phagocytosis in the blood against E. coli (n = 31–32 for preterm, n = 14–21 for near-term) and S. aureus (n = 55–60 for preterm, n = 9–15 for near-term). (c,d) NET response in vitro, shown by the relative increase of plasma cfDNA in samples with stimulation vs. control, following blood stimulation with PMA 100 ng/mL or LPS 1 μg/mL for 3 h (n = 51–58 for preterm, n = 12–20 for near-term pigs). (e,f) TLR2-mediated production of IL-6 and TNF-α in whole blood (n = 12 for preterm, n = 12–21 for near-term). In (a,b,e,f) #, ##, ###P < 0.05, 0.01 and 0.001, compared with corresponding values at birth. In (c,d) #P < 0.05, compared with the corresponding control without stimulation, which was assigned with an arbitrary unit of 1. ** and ***P < 0.01 and 0.001, compared between preterm vs. near-term pigs at the same time period.

