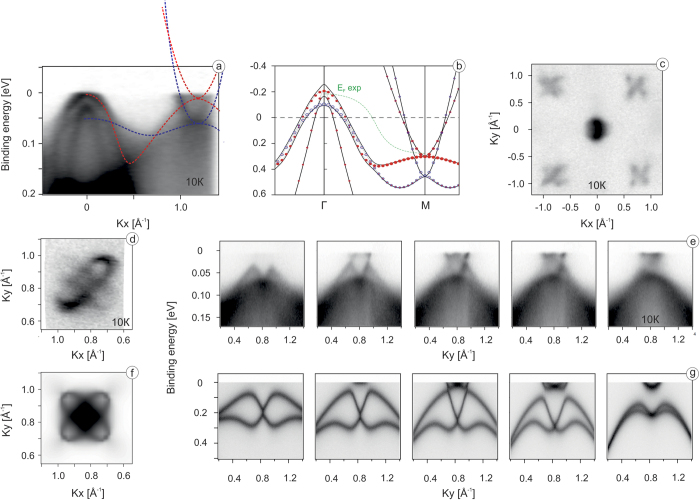
Figure 1. ARPES data compared to corresponding band-structure calculations of the tetragonal phase of FeSe.
(a) ARPES intesity along the diagonal of the BZ; (b) full relativistic (solid lines) and scalar-relativistic (symbols) calculations for the tetragonal phase; red symbols represent dxz,yz states, blue symbols represent dxy states; (c) ARPES-derived Fermi surface map acquired at hν = 100 eV showing the full Brillouin zone with the hole-like pocket in its center and electron-like pockets in its corners; (d) high-resolution Fermi surface map of electron pockets measured at hν = 28 eV; (e) momentum-energy intensity maps taken at 0.2, 0.15, 0.1, 0.5, 0 Å−1 from the center (0.82 Å−1) of electron pockets; (f) electron pockets simulated by the integration within 5 meV of band structure at 250 meV binding energy of bare DFT results; (g) corresponding to panel e calculated momentum-energy intensity maps.

