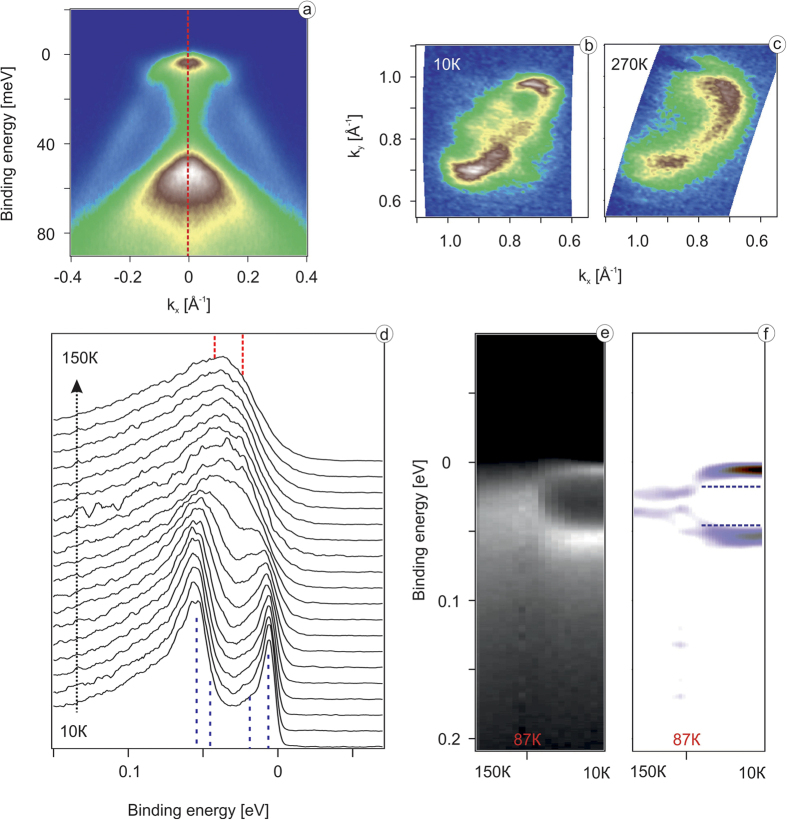
Figure 3.
(a) High resolution ARPES data along the shortest A–A direction in vicinity of the A point; (b) high resolution ARPES derived Fermi surface in vicinity of A point measured with hν = 28 eV and T = 10 K; (c) ARPES derived Fermi surface in vicinity of A point measured with hν = 28 eV and T = 270 K; (d) EDC curves taken at the A point measured at temperatures from 10 K to 150 K; (e,f) color plot representation of data from panel (d) and its second derivative, respectively.

