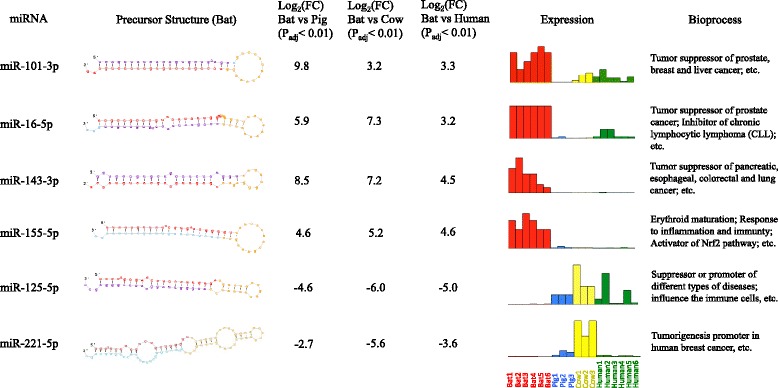
Fig. 5.

The summary of 6 differentially expressed (DE) miRNA. For the precursor structure, nucleotides highlighted in red indicate observed mature sequences, yellow for predicted stem loop region, blue for predicted star sequence and purple for observed star sequence. The fold changes between bat and other species were calculated by DESeq respectively. The relative miRNA expressions in each library were normalized using quantile normalization from the raw counts. The supporting references for the bioprocesses that miRNA are involved in are listed in the Additional file 2: Text S1
