Figure 3.

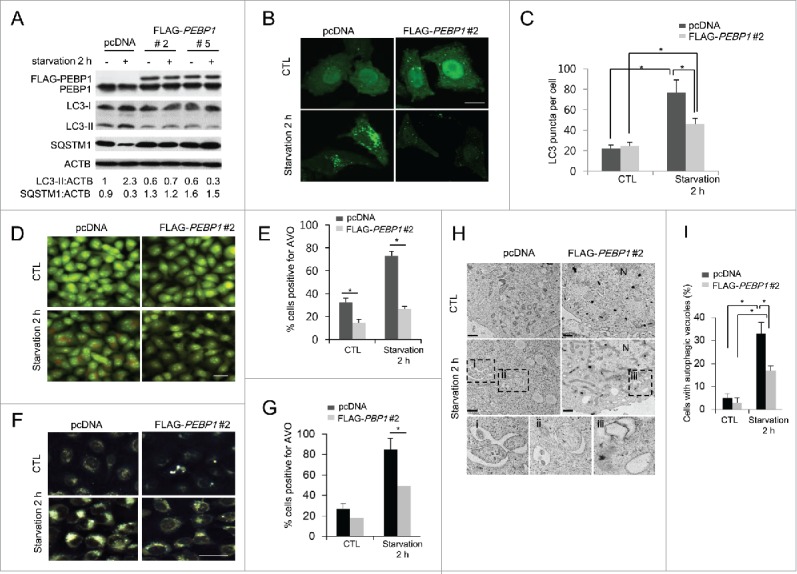
Overexpression of PEBP1 suppresses starvation-induced autophagy. (A) HeLa cells stably selected with control plasmid (pcDNA) or FLAG-tagged PEBP1 plasmid (clones #2 and 5) were starved for 2 h. Total cell extracts (30 μg) were analyzed by 12% SDS-PAGE and western blot using LC3, SQSTM1, and PEBP1 antibodies. ACTB/β-actin was used as a loading control. Proteins were quantified using NIH ImageJ software. Numbers below each lane indicate the relative signal intensity ratio between LC3-II, or SQSTM1 and ACTB, as calculated from 3 independent experiments. (B) Detection of GFP-LC3 puncta in PEBP1-overexpressing cells. HeLa cells stably expressing FLAG- PEBP1 (clone #2) or control vector (pcDNA) were infected with recombinant adenoviral vector expressing GFP-LC3 (Ad-GFP-LC3). After incubation for 24 h, cells were starved for 2 h, and GFP-LC3 puncta were examined under a fluorescence microscope. Quantification of the number of GFP-LC3 puncta per cell is shown in (C). Numbers of GFP-LC3 puncta per cell were determined by counting 20 cells for each sample, which were selected from 6 different areas. Data represent the mean (± SD) of 3 independent experiments (*p < 0.05). Scale bar: 10 μm. (D-G) Detection of acidic vacuoles in PEBP1-overexpressing cells. HeLa cells stably expressing FLAG-PEBP1 (clone #2) or control vector (pcDNA) were starved for 2 h, and acidic vacuoles were detected with AO (D and E) or MDC (F and G) staining. AVO-positive cells were quantified as described in Materials and methods and represented in (E and G). Data represent the mean (± SD) of 3 identical experiments (*p < 0.05). Scale bar: 50 μm. (H) Transmission electron micrograph (TEM) analysis. HeLa cells stably selected with pcDNA or FLAG-PEBP1 were starved for 2 h and subjected to TEM analysis as described in Materials and methods. Sections (90-nm thin) were stained and examined under the 120 kV-transmission electron microscope. The autophagic vacuoles are represented in the enlarged boxes (i, ii and iii). N, nucleus. Scale bar: 1 μm. (I) Quantitative analysis of TEM. The percentage (mean ± SD) of cells containing 5 or more autophagic vacuoles in the cell sections was quantified from at least 50 randomly chosen TEM fields. *p < 0.05.
