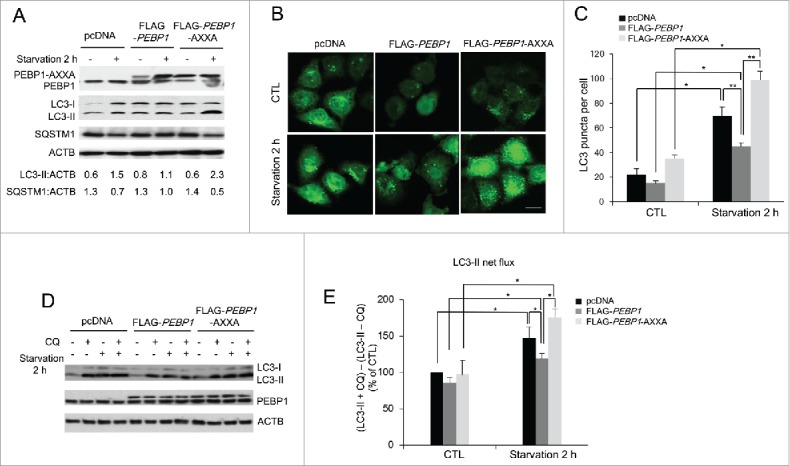
Figure 5.

Mutations in the LIR motif (WXXL) of PEBP1 stimulate autophagy. (A) HeLa cells transiently expressing PEBP1 or PEBP1-AXXA mutant proteins were starved for 2 h, and total cell extracts were harvested for 12% SDS-PAGE analysis by western blot using LC3, SQSTM1, and PEBP1 antibodies. ACTB was used as a loading control. Numbers below each lane indicate the relative signal intensity ratio between LC3-II or SQSTM1 and ACTB, as calculated from at least 3 independent experiments. (B) Detection of GFP-LC3 puncta in cells expressing PEBP1-AXXA mutant proteins. HeLa cells transiently overexpressing PEBP1 (FLAG-PEBP1), PEBP1 mutant (FLAG-PEBP1-AXXA) proteins or control (pcDNA) were infected with Ad-GFP-LC3. After 24 h, cells were starved for 2 h, and then GFP-LC3 puncta were examined by fluorescence microscopy and quantified as shown in (C). Scale bar: 10 μm. The data represent the mean (± SD) of 3 independent experiments (*p < 0.05, **p < 0.01). (D) Determination of the autophagic flux in PEBP1-AXXA mutant cells. HeLa cells overexpressing PEBP1 or mutant proteins (FLAG-PEBP1-AXXA) were starved for 2 h in the absence or presence of 20 μM chloroquine (CQ). Production of LC3-II was analyzed by western blot analysis by 4-20% gradient SDS-PAGE and quantified. ACTB was used as an internal control. Data represent the mean (± SD) of 3 independent experiments. (E) LC3-II net flux was determined by subtracting the densitometric value of LC3-II in nontreated samples (LC3-II -CQ) from the value corresponding to the chloroquine-treated samples (LC3-II +CQ). *p < 0.05.
