Figure 6.

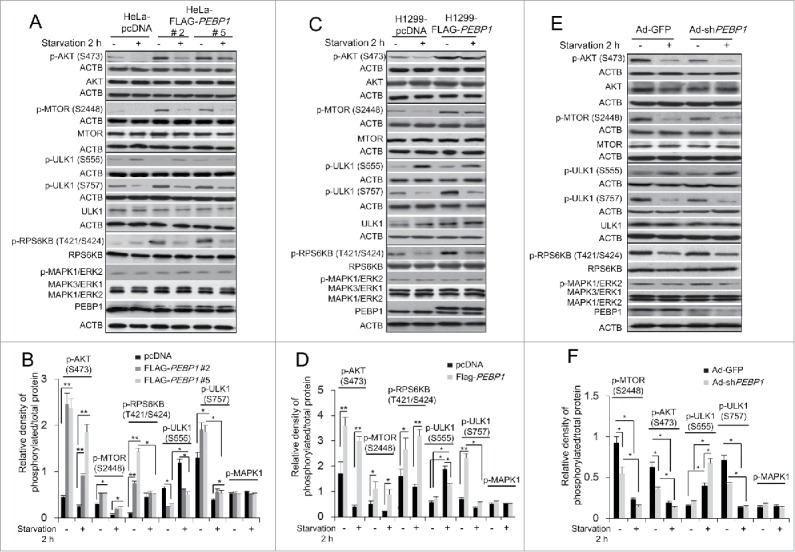
Overexpression of PEBP1 activates the AKT-MTORC1 pathway. (A) HeLa cells stably selected with control pcDNA vector or FLAG-PEBP1-expressing plasmids (clones #2 and #5) were starved for 2 h, and total cell extracts were prepared for analysis by western blot using antibodies against phospho-AKT (S473), phospho-MTOR (S2448), phospho-RPS6KB/p70S6K (T421/S424), phospho-ULK1 (S555 and S757) and phospho-MAPK3/ERK1 and MAPK1/ERK2. ACTB was used as a loading control. Protein and phosphorylation levels were quantified and graphed as shown in (B). (C) H1299 cells stably selected with control pcDNA vector or FLAG-PEBP1-expressing plasmid were analyzed as described above and quantified as shown in (D). (E) HeLa cells were infected with the adenoviral vectors encoding PEBP1 shRNA (Ad-shPEBP1) or control vector (Ad-GFP). After incubation for 72 h, cells were starved for 2 h, and whole cell extracts were analyzed by western blot and quantified as shown in (F). Data represent the mean (± SD) of 3 independent experiments (*p < 0.05, **p < 0.01).
